Protect or not to Protect? That is the question!
Protect or not to protect is one of the key questions to trading successfully. When to add protection, why, or how much are all important decisions and are sometimes very hard to answer. We have been in a very bullish market but that does not mean there are times where protection will not be needed. Pullbacks, corrections or bear markets can all require protection on equity positions. Earnings is one of the most volatile times for significant stock movement that may not always be bullish. Here is what I know and what I want to show you today in this blog. How can you protect in a down market? And some proof that it works.
Asset allocation is supposed to be the key to protecting portfolios. It may include diversification, inverse correlating industries or asset classes, or quick buying and selling based on valuations of equities. I hope from 2008 you learned diversification was never protection. The IMF announced a global slowdown which means all asset classes fall. What about gold? I know it is not a currency, will not be accepted to pay for a mortgage or food purchase, and isn’t plentiful enough to be used as a commodity in the United States. It is just gold and has not been reacting to global slowdown pressures as it lost 1/3 of its value from the $1900 an oz highs. It is my belief that you need the right to sell a stock at a certain price for a certain period of time. That right is the best way to truly protect portfolios. It stands the test of time. I want to go over what happens to real portfolios through October 7th – 9th, of 2014.
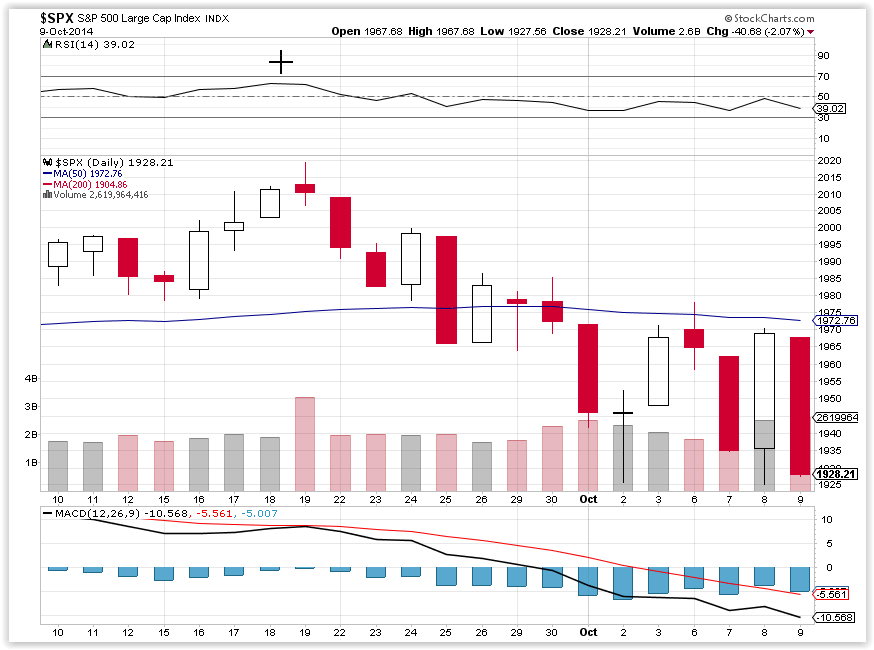
Below is a chart of the last month on the SPX or S&P 500 Index. Lower highs and lower lows confirm a short term bearish trend. Highs of 2020 and a low of 1925. 95 points down is almost a 5% pullback in our stock market and it seems to be a rather orderly drop in the market until the last three days. I do not know if this is the long awaited correction? It may be a correction, pullback or a 40% bear market? What I do know is the 22nd and 23rd of September confirmed a bearish crossover using the RSI, 5 & 20 EMA, and the MACD. Protection went on and then the next day we had a 22 point up day finishing above the previous day’s high. It sucks to put protection on and to then see it lose value but investing is investing. A longer time outlook usually always helps in profitable trading. I decided to keep protection on and to use it the get thru the earnings season that started on October 8th with Alcoa, Inc.
OCTOBER 7, 2014
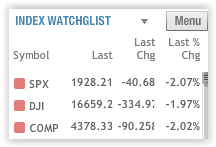
DJIA – Down 1.6% or 272.52 points
SPX – Down 1.51% or 29.72 points
COMP – Down 1.56% or 69.60 points
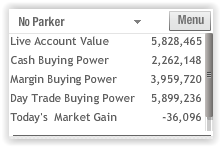
Big losses occurred in the stock market. 1% movement or more is a huge one day move and it invokes the emotion of fear in any trader. To attempt to place protection through the use of the long put option will cost you a premium during all the volatility. The key is to attempt to place the protection on while it is cheap. That usually is a couple of weeks before earnings event or at technical crossovers to follow the trend. I took a screen shot of the drop on this day and I want to work the numbers for you.
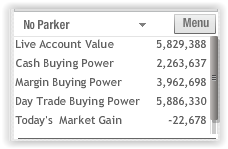
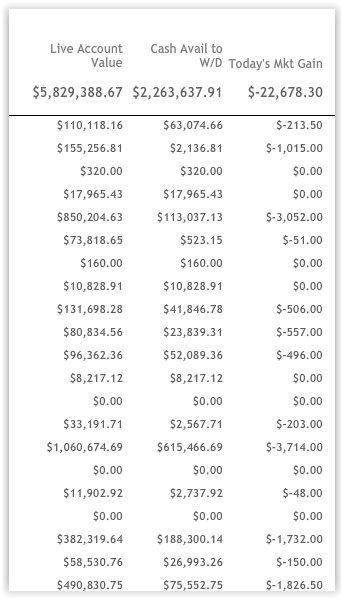
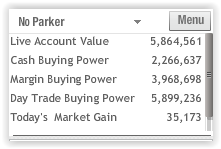
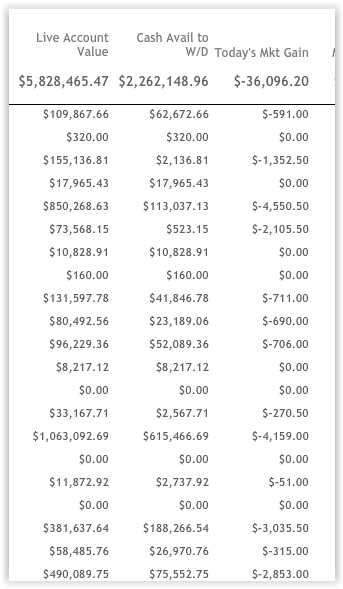
22,678/5829388= 0.00389 or 0.4% loss. I was able to make up 75% of the downward movement of the one day market movement. Let me show you what the losses look like on an individual account basis. Ask yourself if you can handle the losses on the “Today’s Market Gain” then calculate how much a 1.5% loss would be on the “Live Account Value”. If you like what you see call 888-287-1030, click on the “about” tab on the website to leave your email address or send an email to customerservice@hurleyinvestments.com so I can get you into a free online webinar about Safe Option Strategies.
On an individual account basis
Why do I feel somewhat OK ? – The stocks I’ve chosen to have as “core holdings”
AAPL, BIDU, DIS, V, F, NVDA, MS, VZ
Speculative – FB, SNDK, BBY, SBUX, TSLA, BAC, C, ZION
Dividend Payers – LNCO, VZ
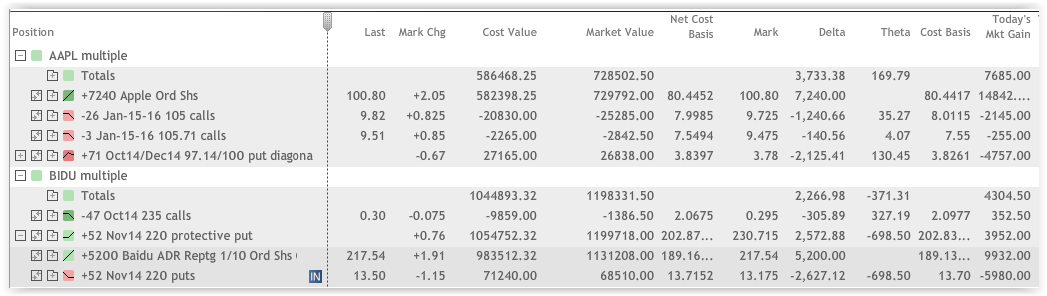
How am I trading to not take such a huge hit like the market? Collars, Protective puts and In The Money (ITM) covered calls protect stock ownership. Lets go over the numbers for AAPL and BIDU
BTO ( Buy to Open) AAPL shares at an average cost basis of $80.4452
Risk in the trade is EVERY penny of the stock $80.45 if we round up a half of a penny. I do not think AAPL will go out of business but it has and could lose half of its value pretty quickly. It has the past history to prove the possible drops in the stock.
BTO the 100 Dec 14 puts for 5.887 per share to have the right to sell the stock at $100 until the third Friday of December
New cost in the trade? 80.45 + 5.89 = $86.34
New Risk in Trade? Right to sell at $100 – new cost of trade $86.34 = Profit of $13.66 or a guaranteed profit
I also have 105 Jan 16 short calls with a credit of $7.99 and 105.71 Jan 16 short calls for $7.55 credit on 1/3 of the shares to help pay for protection.
Short puts are at $97.14 for a $1.55 credit to also pay for the protection of the long puts. What a great trade to be in!
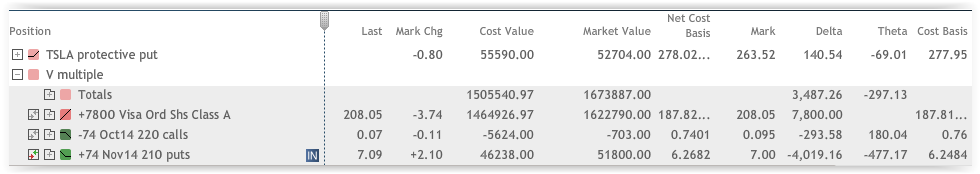
I have other positions protected. Some do not have all the shares protected due to client requests or for a transfer occurring where the options are already in other accounts waiting for the shares to arrive.
DIS has a stock price of $70.85 with Long put protection at $90 a share until the third Friday of Nov

TSLA and V with long put protection. Visa bought at $187.82 with the right to sell @ $210 for a cost of $6.27
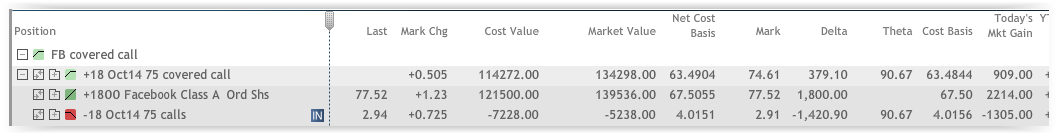
FB is a little different protected position. In fact a covered call truly is never considered protection by an experienced trader.
BTO the stock at $67.50
STO a 75 Oct 14 call for $4.01 credit
Breakeven 67.50 – 4.01 = $63.49 at risk in trade
Max Reward = Obligated to sell at $75 – cost basis/breakeven 63.49 = Profit of $11.51
OCTOBER 8th, 2014
DJIA – Up 1.62% or 274.83 points
SPX – Up 1.72% or 33.79 points
COMP – Up 1.90% or 83.39 points
OCTOBER 9th, 2014
Individual Accounts on such a rough day and don’t forget to multiply the “Live Account Value” by the 2.07% drop. This is where giving up a little on the upside protects you significantly on the downside.
Net for the three days on almost 6 million portfolio -22678 + 35,173 – 36096 = -23601 or 0.4%
Net for market SPX over the same three days -1.51 +1.72 -2.07 = -1.86 %
IF I just had diversification I would be down 5,828,465 * 0.0186= $108,409
I am giving all this information to offer investors examples of the need to protect a portfolio. Rights and responsibilities of the long put option offer the right to sell at a certain price and makes all the difference in trading. I manage accounts adding protection as needed. If we do have a 40% drop like the TV talking heads are predicting we will end up being profitable in the accounts while everyone else losses 40% again. Why is that so important? Losing 40% on a 100K portfolio means you have only 60K or a 66% return to just break even again. Hurley Investment clients will make a little and may have 102K to trade while everyone else is trying to break even. Where would you like to be and how would you like your retirement traded? I KNOW MY ANSWER!
If you like what you see call 888-287-1030, click on the “about” tab on the website to leave your email address or send an email to customerservice@hurleyinvestments.com so I can get you into a free online webinar about Safe Option Strategies.
HI Financial Services Mid-Week 04-29-2014