HI Financial Services Commentary 05-02-2017
Click on the link: https://youtu.be/foiSgn6KrKY
Sometime the returns you want, earnings prove and that someone else needs just doesn’t happen.
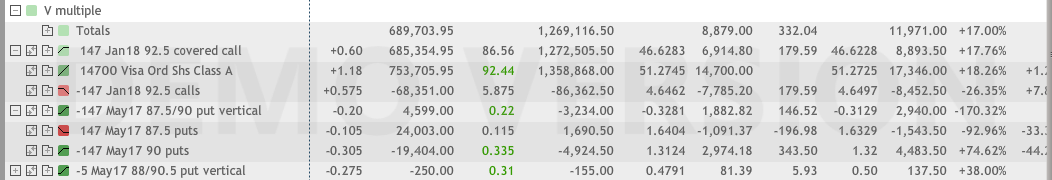
That Investing is gathering shares thru option protection without having to add more money to the account
I subscribe to the Warren Buffet Idea of having good stocks and protection through the long put and sometimes adding longer term covered calls
What’s happening this week and why?
AAPL Earnings which beat top and bottom line BUT guidance missed and Iphone number were down
FOMC Rate meeting started today and 2:15 EST announcement – NO Rate Hike
Where will our market end this week?
Higher
DJIA – Bullish

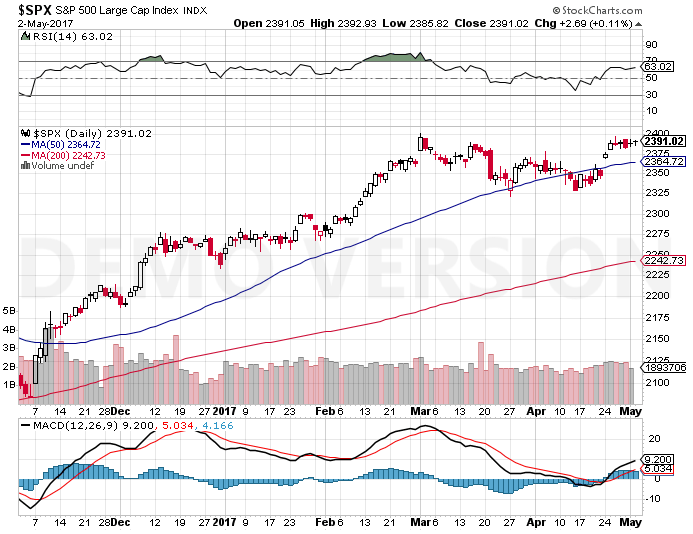
SPX – Bullish
COMP – Bullish to Overbought

Where Will the SPX end May 2017?
05-02-2017 +2.0%
What is on tap for the rest of the week?=
Earnings:
Tues: AET, AKAM, CVS, COH, GILD, FSLR, FEYE, DVN, DENN, CMI, COP, GDDY, PFE, MYGN, MOS, MRK, HLT, PZZA, AAPL, MA
Wed: EL, GRMN, S, TWX, YUM, AIG, CTL, KHC, MUR, TSLA, RIG, FB,
Thur: BZH, CAB, CHK, FLR, K, CBS, HLF, MRO, NE, CLX,
Fri: CI, MCO
Econ Reports:
Tues: Auto, truck
Wed: MBA, Crude, ADP Employment, FOMC Rate Decision
Thur: Initial, Continuing Claims, Factory Orders, Productivity, Unit Labor Costs
Fri: Average Workweek, Non-Farm Payroll, Private Payroll, Unemployment Rate, Hourly Earnings, Consumer Credit
Int’l:
Tues –
Wed –
Thursday –
Friday –
Sunday – France Voting
How I am looking to trade?
Finishing up earnings with Protective puts or collars. Bull Putting the protection when possible
Questions???
www.myhurleyinvestment.com = Blogsite
customerservice@hurleyinvestments.com = Email
http://www.cnbc.com/id/104435614
Here’s why earnings are so outstanding even though the US economy is barely growing
- CNBC analysis found that the difference between earnings per share growth and gross domestic product expansion in the first quarter is the widest since the third quarter of 2011.
- Strong global growth is making up for the lack of activity domestically.
- S&P 500 companies that generate more than half their revenue overseas are posting quarterly earnings growth of 19.9 percent on average, double that of companies that conduct most of their business domestically, according to FactSet.
Sunday, 30 Apr 2017 | 9:08 PM ETCNBC.com
So far this earnings season, the less a U.S. company is exposed to America, the better its results.
S&P 500 companies that generate more than half their revenue overseas are posting first-quarter earnings growth of 19.9 percent on average, double that of companies that conduct most of their business domestically, according to FactSet. About 60 percent of the S&P 500 has reported results.
That helps explain the gap between the strong quarterly results and sluggish economic data like Friday’s report showing U.S. GDP increased at just 0.7 percent in the first quarter, its slowest pace in three years. In fact, a CNBC analysis found that the difference between earnings per share growth and gross domestic product expansion in the first quarter is the widest since the third quarter of 2011.
“We’re seeing some pickup in growth that’s outside the U.S. that’s being reflected in these earnings numbers,” said Nick Raich, CEO of The Earnings Scout, pointing out that “the U.S. data is domestic focused.”
About 46 percent of S&P 500 sales overall come from foreign markets.
The U.S. is still the world’s largest economy, but its growth has stagnated while that of the rest of the world has been picking up.
The International Monetary Fund last month raised its annual growth forecasts for China and the euro area by 0.1 percent from its report in January. The estimate for the U.S. economy was unchanged.
The IMF raised estimates for Japan and the U.K. by 0.4 percent and 0.5 percent, respectively, for an estimated overall 0.1 percent uptick in global growth this year. This time last year, the IMF had cut its global growth outlook by 0.2 percent.
Key reasons for last year’s sluggishness was a plunge in oil prices and other commodities prices, that added to the struggles of China as it attempts to transition its economy away from manufacturing exports to developing its services industry.
As a result, major U.S. firms dependent on China and commodities markets have surprised in the first quarter of this year.
For example, Caterpillar crushed earnings estimates and posted its first year-over-year sales increase in more than two years. The Dow component said its Asia Pacific sales rose 12 percent “primarily due to an increase in construction equipment sales in China resulting from increased infrastructure and residential investment.”
In the first quarter of last year, Caterpillar’s Asia Pacific sales dropped 23 percent.
U.S. banks have also posted strong first-quarter earnings, helped by rising interest rates, improving global growth and increased trading revenues. Bank of America, JPMorgan Chase and Morgan Stanley reported large earnings beats that contributed substantially to the S&P 500’s earnings growth in the first quarter, according to FactSet.
Overall S&P 500 earnings per share growth is on track for an increase of more than 12 percent for the first quarter, the greatest since the third quarter of 2011.
Other factors helping earnings and overseas economic growth are softness in the U.S. dollar and stabilizing oil prices.
The greenback has traded mostly lower this year after sharp gains in 2014 and 2015 that cut into overseas profits.
Meanwhile, oil recovered from a sub-$30 a barrel low last February to trade in a range near $50 a barrel. U.S. crude is up about 7 percent over the last 12 months.
To be sure, there’s another reason why earnings look so good: A year ago, they were pretty bad.
Last year’s poor results for S&P 500 companies overall, including four straight quarters of earnings decline, set a low bar for companies to overcome. Matching improved growth in coming months may be more difficult.
But they continue to grow at a healthy pace with help from the globe.
“We have been more focused on improving global growth than on the ‘Trump trade,'” hedge fund manager Dan Loeb told clients in a Thursday letter obtained by CNBC.
“Although S&P earnings were flat over the past three years,” Loeb said, “we are expecting earnings growth to drive gains and cyclical names to get a tailwind from U.S. policy shifts this year.”
Third Point has doubled the market’s return over the last two decades.
— CNBC’s Scott Wapner and John Melloy contributed to this report.
https://hbr.org/2016/11/how-to-make-better-decisions-with-less-data
How to make better decisions with less data
NOVEMBER 07, 2016
Maria, an executive in financial services, stared at another calendar invite in Outlook that would surely kill three hours of her day. Whenever a tough problem presented itself, her boss’s knee-jerk response was, “Collect more data!” Maria appreciated her boss’s analytical approach, but as the surveys, reports, and stats began to pile up, it was clear that the team was stuck in analysis paralysis. And despite the many meetings, task forces, brainstorming sessions, and workshops created to solve any given issue, the team tended to offer the same solutions — often ones that were recycled from prior problems.
As part of our research for our book, Stop Spending, Start Managing, we asked 83 executives how much they estimated that their companies wasted on relentless analytics on a daily basis. They reported a whopping $7,731 per day — $2,822,117 per year! Yet despite all of the data available, people often struggle to convert it into effective solutions to problems. Instead, they fall prey to what Jim March and his coauthors describe as “garbage can” decision making: a process whereby actors, problems, and possible solutions swirl about in a metaphorical garbage can and people end up agreeing on whatever solution rises to the top. The problem isn’t lack of data inside the garbage can; the vast amount of data means managers struggle to prioritize what’s important. In the end, they end up applying arbitrary data toward new problems, reaching a subpar solution.
YOU AND YOUR TEAM SERIES
Thinking Strategically
To curb garbage-can decision making, managers and their teams should think more carefully about the information they need to solve a problem and think more strategically about how to apply it to their decision making and actions. We recommend the data DIET approach, which provides four steps of intentional thought to help convert data into knowledge and wisdom.
Step 1: Define
When teams and individuals think about a problem, they likely jump right into suggesting possible solutions. It’s the basis of many brainstorming sessions. But while the prospect of problem solving sounds positive, people tend to fixate on familiar approaches rather than stepping back to understand the contours of the problem.
Start with a problem-finding mindset, where you loosen the definitions around the problem and allow people to see it from different angles, thereby exposing hidden assumptions and revealing new questions before the hunt for data begins. With your team, think of critical questions about the problem in order to fully understand its complexity: How do you understand the problem? What are its causes? What assumptions does your team have? Alternately, write about the problem (without proposing solutions) from different perspectives — the customer, the supplier, and the competitor, for example — to see the situation in new ways.
Once you have a better view of the problem, you can move forward with a disciplined data search. Avoid decision-making delays by holding data requests accountable to if-then statements. Ask yourself a simple question: If I collect the data, then how would my decision change? If the data won’t change your decision, you don’t need to track down the additional information.
Step 2: Integrate
Once you’ve defined the problem and the data you need, you must use that information effectively. In the example above, Maria felt frustrated because as the team collected more and more pieces of the jigsaw puzzle, they weren’t investing the same amount of time to see how the pieces fit together. Their subconscious beliefs or assumptions about problems guided their behavior, causing them to follow the same tired routine time and time again: collect data, hold meetings, create strategy moving forward. But this is garbage-can decision making. In order to keep the pieces from coming together in an arbitrary fashion, you need to look at the data differently.
Integration lets you analyze how your problem and data fit together, which then lets you break down your hidden assumptions. With your team, create a KJ diagram (named after author Kawakita Jiro) to sort facts into causal relationships. Write the facts on notecards and then sort them into piles based on observable relationships — for example, an increase in clients after a successful initiative, a drop in sales caused by a delayed project, or any other data points that may indicate correlated items or causal relationships. In doing this, you can create a visual model of the patterns that emerge and make connections in the data.
Step 3: Explore
At this point in the process, you may have some initial ideas or solutions based on your KJ diagrams. Now’s the time to develop them. To facilitate collaborative exploration, one of our favorite exercises (often used in art schools) is what we call the passing game. Assign distinct ideas to each team member and give each individual five minutes to develop it by drawing or writing in silence. Then have them pass their work to a teammate, who continues drafting the idea while they take over a teammate’s creation.
Discuss the collaborative output. Teammates recognize how it feels to give up “ownership” of an idea and how it feels to both edit and be edited; they also recognize their implicit assumptions about collaboration. The new perspective forces them to confront directions that they didn’t choose or never would have considered. Indeed, you can add multiple sequential passes (like a telephone game) to demonstrate the idea’s unpredictable evolution as three or four teammates play with the initial ideas. After allowing people this space for exploration, discuss the directions that are most fruitful.
Step 4: Test
The last dimension requires team members to use their powers of critical thinking to consider feasibility and correct for overreach. Design tests to see if your plan forward will work. Under which types of situations will the solution fail? Select a few critical tests and run them. While people often over-collect data that supports their priors, people under-collect disconfirming data. By running even a single test that fights confirmation biases, you can see what you need to see, even if you don’t want to.
The solution to garbage-can decisions isn’t cutting out data entirely. Thinking strategically about your data needs pushes you to do more with less — widening, deepening, integrating, extending, and testing the data you do have to convert it into knowledge and wisdom. In practicing the mental exercises above with your team, you can curb your appetite for data while getting better at digesting the data you have.
David Stockman: Trump’s tax plan is ‘dead on arrival’ and Wall St. is ‘delusional’ for believing it
Sunday, 30 Apr 2017 | 5:00 PM ETCNBC.com
David Stockman has a stern message for investors: They’re living in a fantasy land about Trump.
In a recent interview on CNBC’s “Futures Now,” the former director of the Office of Management and Budget under President Reagan said that “Wall Street is totally misreading Washington,” and President Trump’s promises of tax reform will be “dead before arrival.”
The president is “essentially a 70-year old kid in a candy store who wants one of everything: More for defense, veterans, border walls, law enforcement, infrastructure and ‘phenomenal’ tax cuts, too—without the inconvenience of paying for any of it,” said Stockman.
Of the proposed tax bill announced this week, he said, “It’s a wonderful fantasy…but there’s no way to pay for the $7.5 trillion cost of the main features.”
‘Total calamity’
The White House announced a one-page tax reform plan on Wednesday, and some of the points Stockman highlighted include: Three tax brackets, double standard deduction and the reduction of corporate and non-corporate business taxes down to 15 percent.
In a research note this week, Goldman Sachs pegged the cost of the tax plan to just under $5 trillion, when factoring in key changes such as repealing of the state and local tax, and a 35 percent top marginal rate instead of 33 percent. Goldman analysts expect the tax bill is “fairly likely” to become law, but warned progress could be slow.
“I like [the tax plan] but you have to pay for it either with a new tax like the border adjustment tax, which is dead, or spending cuts which Trump has ruled off the table,” Stockman explained. “What you have down there is a total fiscal calamity that is going to basically dominate Washington.”
Stockman expects a “constant fiscal crisis and stalemate” in D.C., which will ultimately delay the “good stuff,” like a tax cut, from ever happening.
Of Trump’s first 100 days in office, Stockman again referred to the White House as a “pop up store giving out candy before the 100th day to say they’ve accomplished something.” Adding, “this isn’t a serious plan, it can’t be done. And I think it’s only indicative of the huge trouble that’s brewing down there in the beltway.”
Despite Trump’s somewhat tumultuous first few months in office, the stock market has been resilient. The S&P 500 Index is up 11 percent since the election and 5 since the inauguration, the third best performance under a new administration since World War 2. On Friday, the S&P traded within 1 percent of its all-time high.
Eventually, however, Stockman expects the drama in D.C. to trickle into equities, sparking a significant pullback.
“I don’t know what the stock market is thinking but if they have faith in a giant fiscal stimulus and tax cut then it’s a delusional faith that’s going to be badly disappointed and I think fairly soon,” he added.
HI Financial Services Mid-Week 06-24-2014