
HI Financial Services Commentary 05-30-2017
You Tube Video Link: https://youtu.be/GXLhT3iK2dI
June is on average a flattish month and the fourth worst in terms of the S&P 500 performance, but it alslso marks the start of the weak summer season for equities. September is historically the worst month and August second worst, followed by February
Melt up, Trumpism with a sprinkle of Hope and tons of fear
VIX yesterday down below 10 again
“Incremental buyer”
What’s happening this week and why?
Trump and Merkle sparing over words, trade balances and NATO payments
Personal Income 0.4 vs est 0.4
Personal spending 0.4 vs est 0.4
PCE Prices 0.2 vs est 0.1
Consumer confidence 117.9 vs est 119.5
Where will our market end this week?
Lower based on the technicalls
DJIA – Bullish 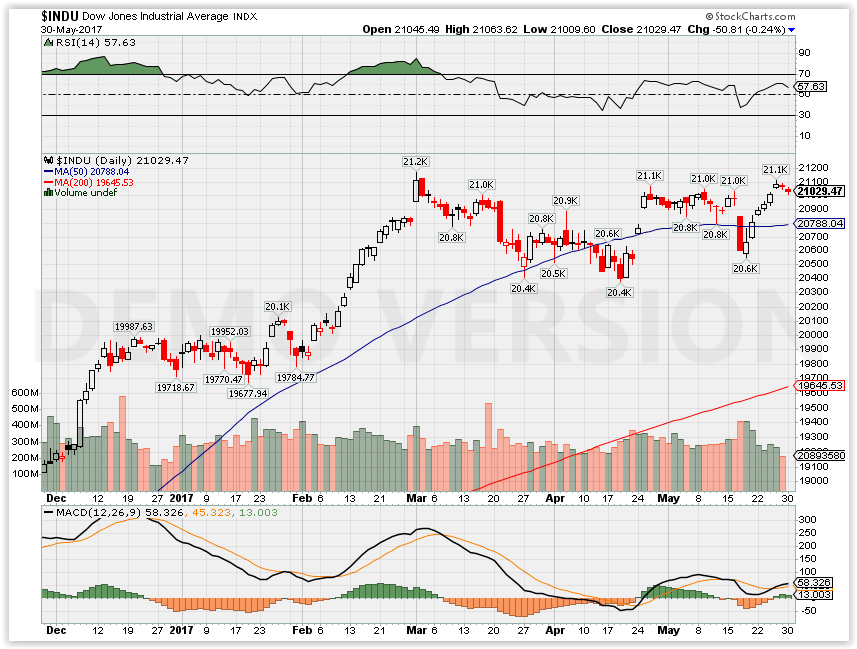
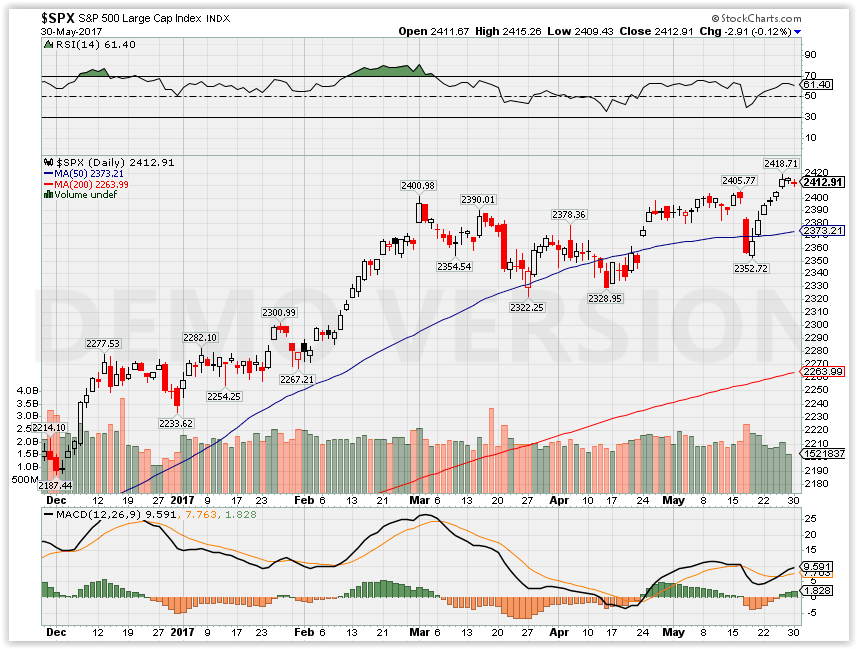
SPX – Bullish 30 million shares were traded today with an average of 77 million
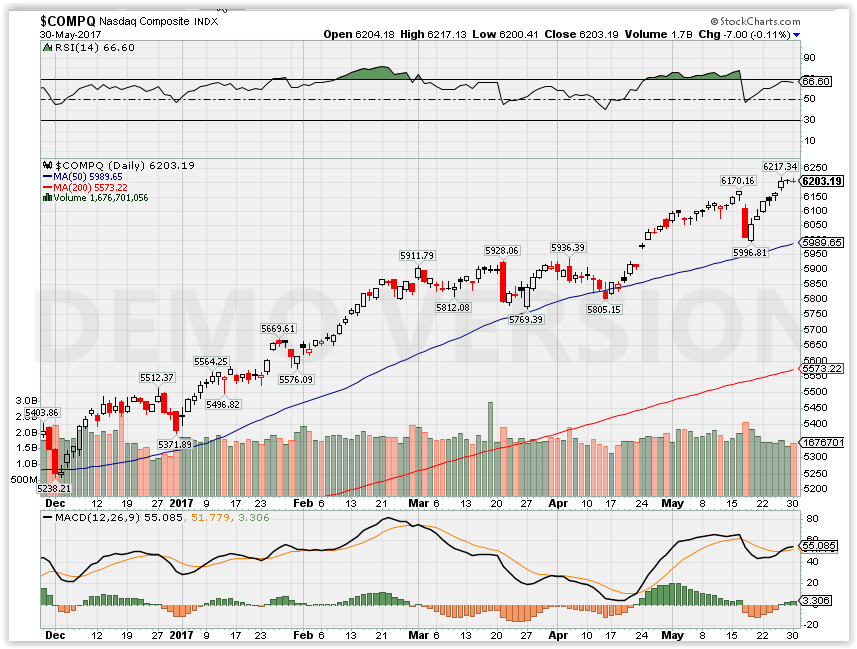
COMP – Bullish
Where Will the SPX end June 2017?
05-30-2017 -2.0%
What is on tap for the rest of the week?=
Earnings:
Tues:
Wed: PANW
Thur: DG, FIVE, LULU, VMW
Fri:
Econ Reports:
Tues: Personal Income, Personal Spending, PCE Prices, Consumer Confidence
Wed: MBA, Crude, Chicago PMI, Pending Home Sales, Fed Beige Book
Thur: Initial, Continuing Claims, ADP Employment, Productivity, Unit Labor Costs, Construction Spending, ISM Index, Auto, Truck
Fri: Ave Workweek, Non-Farm Payroll, Privat Payroll, Unemployment Rate, Hourly Earnings
Int’l:
Tues – JP: Industrial Production, CN: CFLP Manufacturing PMI
Wed – JP: PMI Manufacturing
Thursday – FR:DE: PMI Manufacturing Index
Friday –
Sunday – JP: PMI Composite, CN: General Services PMI
How I am looking to trade?
For some financial – ZION I did a mixture of 40/36 & 39/36 July Bear Puts, BAC sitting on but looking to add Short calls,
V still have 92.50 Jan 18 short calls for 4.60 credit looking to roll higher on the next pullback
AAPL, BIDU have short calls in July,
F Long Puts at 11, FB Collared thru July, DIS 113, 115 long puts June
Looking to sell credit for a sideways moving market – bull puts, short puts and little credit high short calls
Questions???
www.myhurleyinvestment.com = Blogsite
customerservice@hurleyinvestments.com = Email
Big tech accounts for a third of the gains in stocks, but that could be trouble for the market
Apple, Amazon, Facebook, Microsoft and Alphabet Class A shares account for about a third of the S&P 500’s gains this year, underscoring tech’s breakout year.
Experts say the market could be vulnerable to a pullback if other stocks don’t pick up some slack.
Large-cap tech stocks have been the stalwart of the U.S. equity market this year, but other stocks need to pick up some slack to keep the good times rolling.
Approximately a third of the stock market’s gains this year have come from just five stocks as of last week: Apple, Amazon, Facebook, Microsoft and Alphabet Class A shares, according to data from Howard Silverblatt, senior index analyst at S&P Dow Jones Indices. On Tuesday, Amazon broke above the major milestone of $1,000 a share for the first time.
The disproportionate contribution of gains from those five issues underscores the tech sector’s eye-popping performance this year. Information technology has risen nearly 20 percent in 2017. By comparison, the second-best-performing sector this year — consumer discretionary — is up 11.5 percent in the period.
U.S. stocks have been on fire this year, with the S&P 500 up 7.7 percent but the tech-heavy Nasdaq up more than twice that amount with a 15.3 percent gain. The two indexes also notched record closing highs on Friday.
“The good news is the market is at an all-time high. The bad news is it happened on the back of a few tech stocks,” said Art Hogan, chief market strategist at Wunderlich Securities. “One of two things happen from here: Either the leadership fails and drags the market lower, or we see other sectors pick up some slack.”
Marc Chaikin, CEO of Chaikin Analytics, said financials could be one of those sectors. “Based on what we heard from the [Federal Reserve] last week, I think they’re due for a second wind,” he said.
The Fed has forecast two more interest-rate hikes this year, and last week discussed plans to unwind its $4.5 trillion balance sheet. The plan, released in the minutes of its last meeting, showed the Fed will slowly reduce the balance sheet in a deliberate process that includes announcing cap limits on how much it will trim its holdings in Treasury and mortgage securities.
Financials are essentially flat for 2017 but surged right after President Donald Trump’s election in November on hopes of tax reform and deregulation. The S&P financial sector is up 0.7 percent so far this year.
Other stocks in the S&P “have to catch up. Otherwise, it leaves the market vulnerable to a correction,” Chaikin said.
Here’s the main reason the market will keep rallying, according to one strategist
Monday, 29 May 2017 | 4:39 PM ET
Bill Stone believes that while investors are focused on what awaits President Donald Trump now that he’s returned to Washington, the market rally will still continue, thanks to strong fundamentals that he expects will carry through the year.
In another week in which the S&P 500 Index hit new all-time highs, PNC Asset Management’s global chief investment strategist laid out the factors that he expects can send the market even higher. On Friday, markets slipped slightly after seeing one straight week of gains.
“We’ll still likely see good [earnings] growth rates for the rest of the year,” he said Thursday on CNBC’s “Futures Now.” In addition, the U.S. economy “is probably going to be picking up here.”
First quarter economic growth “was very weak, but we think you’re going to end up with 2.4 percent growth rate GDP in the U.S.,” he added.
And thanks to the positive economic outlook coming out of the U.S., Stone also thinks that part of the reason why stocks will keep rallying is the Federal Reserve. As a result of expected rate hikes, the market has already priced in tighter monetary policy for this year, which should mean higher returns for investors.
Last week’s Fed policy setting minutes essentially cemented the probability of a rate hike in Jun. Stone told CNBC it’s not out of the question that the Fed could raise again in December.
But until then, Stone says that it’s safe for investors to keep getting into stocks. He mentioned that he sees the tech sector “broadening out” for even more upside in the future, implying that more record highs could be ahead, thanks to big-cap tech.
The ups and downs of sector rotation
Provided by Nasdaq
Friday, 19 May 2017 | 5:24 PM ET
John Lewis, CMT, Senior Portfolio Manager
Nasdaq Dorsey Wright
Nasdaq Dorsey Wright provides a free trial or a customized demo of the DWA Research Platform, which provides turnkey research and analysis for stock selection, portfolio management and asset allocation. To learn which Separately Managed Account Platforms carry our strategies, click here.
Investors have used sector rotation strategies for many years. These strategies have become even more popular recently with the rise of exchange traded funds (ETFs), which have made getting sector exposure much more efficient. Sector rotation strategies do away with stock picking and seek to capitalize on broad industry trends. While some sector strategies use valuation or economic data in order to allocate to the different sectors, one of the most popular ways to analyze sectors is using momentum.
Momentum strategies overweight areas of the market that have performed well in the recent past. Many investors will use a simple moving price window (six or 12 months for example) and rank their potential investments from best to worst over that time period. This approach is very objective, and doesn’t require an extensive knowledge of each sector in the universe. In 1999, Moskowitz and Grinblatt showed in an academic paper1 that there was significant momentum at the industry group level. Even since this anomaly was published many years ago, it continues to deliver outperformance.
The outperformance of sector rotation strategies can be quite significant over time. Since momentum is an objective factor, it is easy to backtest using a set of simple rules. The KenFrench Data Library has data on 48 industry groups going back to the 1920’s. We used this data to look at how well sector rotation strategies have performed over long time horizons, and the risks investors must be aware of to realize the returns.
Dorsey Wright uses a slightly different method to calculate momentum. We use a Point and Figure matrix to rank the industries, rather than a moving time window, over time. If you want to find out more about this ranking methodology you can visit our website, www.dorseywright.com or download our Point & Figure Relative Strength Signals white paper. Both our methodology and a moving time window methodology seek to buy strong industries and avoid weak ones. For the purposes of our study, each month, we ranked each of the 48 sectors from best to worst and separated the universe into quintiles. The sectors were re-ranked each month and the industries were equally weighted within their quintile group. Since we want to own the strongest sectors, we focused on the top quintile when examining the historical returns. We compared the return of the top quintile of groups against the broad market (the CRSP market return from the Ken French Data Library) as well as the bottom quintile of groups.
The returns over time are exceptional if you focus on holding the top groups. The annualized return of the top quintile is 14.1 percent versus 7.7 percent for the bottom quintile, and 9.5 percent for the market. The excess returns do come with more risk (measured by standard deviation), but, from a performance perspective, it is worth the extra volatility.
The “Top Quintile” and “Bot Quintile” performance numbers are based on the back-tested performance of non-investable indexes. Investors cannot invest directly in an index. Indexes have no fees. Please see the final page for important disclosures regarding back-tested performance. Examples presented herein are for illustrative purposes only and do not represent past or present recommendations. Past performance is not indicative of future results. Potential for profits accompanied by possibility of loss.
The excess return over time versus the broad market is shown in the chart below. The upward sloping equity curve shows the exceptional outperformance over time, but it also becomes clear that there are periods of underperformance versus the broad market that investors must tolerate.
When we look at the performance over rolling three-, five-, and 10-year time horizons it is clear that there can be long time periods when owning the top sectors underperforms the broad market. As you get out to longer time horizons like 10 years, the excursions below the 0 percent line (i.e., underperformance) become less frequent. But, at shorter time horizons, underperformance is very normal and doesn’t mean the strategy is “broken.” Remember that the strategy in the backtest was implemented exactly the same way month after month. There are just times when the market rewards other factors, and that has been a normal part of investing for many, many years.
We believe the best course of action for these normal periods of underperformance is patience. Another way to look at the periods of underperformance of a sector rotation strategy is to look at the drawdown relative to the broad market. The chart below shows how often the strategy we created underperforms the broad market by 20 percent or more despite the beneficial returns over time.
Examining the drawdowns in this fashion allows us to look at the larger periods of underperformance and look at how the strategy performed in the six months, one year, two years, and three years after a period of large underperformance. The table below shows the trough of underperformance for the large relative drawdowns over the years. Keep in mind that in the table below we are looking at everything relative to the broad market. So a drawdown level of 30 percent actually means the strategy underperformed the broad market by 30 percent at its worst. The strategy could actually have delivered positive returns during that time period, they just would have been much worse than the market.
Once the strategy’s relative performance bottomed out, the next six to 24 months were critical! Over the six months following the relative bottom, the strategy outperformed the market by 10.6 percent versus 3.8 percent for all of the days in the sample. (Note: These are average returns, not compounded returns). The same type of outperformance exists going out two years from the bottom. By the time you get out three years from the bottom, the strategy was performing in-line with historical averages. However, it is important to note that the strategy wasn’t underperforming! The outperformance after a trough in relative performance was long lasting.
One of the biggest problems that has plagued investors over the years has been a lack of discipline and patience. The data shown above makes it clear that it is normal for a sector rotation strategy to underperform from time to time. This is the case with all investment strategies. No strategy outperforms all of the time! Most investors, however, tend to panic and sell during these periods of underperformance. This can really hurt long term returns because some of the best performance often comes after periods of large underperformance. There are certainly reasons to abandon a strategy. For example, if a manager totally changes philosophy after a period of underperformance it is usually a very good indication to reconsider your investment in that strategy. But when a robust strategy like momentum is implemented in a systematic and disciplined fashion and continues to focus on capitalizing on strong sector moves, it can pay off to hold on during periods of underperformance and wait for the relative rebounds that have come with the strategy over time.
1Moskowitz, Tobias and Grinblatt, Mark, “Do Industries Explain Momentum,” 1999
Nasdaq Dorsey Wright provides a free trial or a customized demo of the DWA Research Platform, which provides turnkey research and analysis for stock selection, portfolio management and asset allocation. To learn which Separately Managed Account Platforms carry our strategies, click here.
DISCLOSURES:
The CRSP U.S. Total Market Index (CRSP) is comprised of nearly 4,000 constituents across mega, large, small and micro capitalizations, representing nearly 100 percent of the U.S. investable equity market. The total return index was first posted on the NASDAQ GIDSSM (Global Index Data ServiceSM) feed on December 31, 2012; the price return index was posted on January 18, 2011.
Nothing contained herein should be construed as an offer to sell or the solicitation of an offer to buy any security. Dorsey Wright (inclusive of its affiliates) is not soliciting any action based on this document. This document does not constitute a personal recommendation or take into account the particular investment objectives, financial situations, or needs of individual clients. Before acting on any analysis, advice, or recommendation in this document, clients should consider whether the security or strategy in question is suitable for their particular circumstances and, if necessary, seek professional advice.
This research paper is based on public information that we consider reliable, but we do not represent it is accurate or complete, and it should not be relied on as such. Opinions expressed herein are our opinions as of the date of this document. Dorsey Wright does not intend to and will not endeavor to update the information discussed in this document.
The projections or other information in the document regarding the likelihood of various investment outcomes are hypothetical in nature, do not reflect actual investment results, and are not guarantees of future results. Results may vary with each use and over time. The outcomes in this document are based on historical market data and are presented to illustrate the relative strength strategy. These outcomes cannot be relied upon in the face of changing market conditions, and should be re-evaluated frequently.
The performance information presented is the result of backtested performance. Back tested performance is hypothetical (it does not reflect trading in actual accounts) and is provided for informational purposes to illustrate the effects of relative strength during a specific period. Back-tested performance results have certain limitations. Such results do not represent the impact of material economic and market factors might have on an investment advisors decision making process if the advisor were actually managing client money. Backtesting performance also differs from actual performance because it is achieved through retroactive application of a model investment methodology designed with the benefit of hindsight.
The relative strength strategy is not a guarantee. There may be times where all investments and strategies are unfavorable and depreciate in value. Relative strength is a measure of price momentum based on historical price activity. Relative strength is not predictive and there is no assurance that forecasts based on relative strength can be relied upon.
ADVICE FROM A SECURITIES PROFESSIONAL IS STRONGLY ADVISED.
ABOUT DORSEY WRIGHT /
Nasdaq Dorsey Wright has been a leading provider of technical research to financial professionals for over 25 years. Our comprehensive research platform is a complete technical analysis solution – from broad market insights, to portfolio management tools and investment models, to Point and Figure charts on over 80,000 securities and indicators worldwide.
FOR MORE INFORMATION /
Visit www.business.nasdaq.com/dorsey-wright-trial to register for a 10-day free trial of our research platform.
HI Financial Services Mid-Week 06-24-2014