
HI Financial Services Commentary 06-06-2017
You Tube Link: https://youtu.be/kbup7KtivHs
What will happen to the typical June Swoon this year?
I’m in financials just like Soros, waiting for financial reformation
Wait and see some kind of progress
I’m going to go with a 2% to maybe 5% pullback
F – Will they continue to go lower?
Higher because they are the number seller of trucks in the US
AAPL will they go higher?
Higher because of the Iphone 8 refresh even if they have some supply constraints
Most robust MAC, New operating system and AI developer’s incentives
DIS ??? % blockbuster billion dollar movies on tap for 2017
Better markets equal more money equal more people attending Disneyland’s worldwide
ESPN not as bad as reported right now and into the future
ZION – IS waiting on Dodd/Frank Repeal and lessen the loan restrictions so they can move $20 higher with earnings to back the increase in stock price
What’s happening this week and why?
Slow week
Conflicting data right now and congress out of session for summer
Where will our market end this week?
???
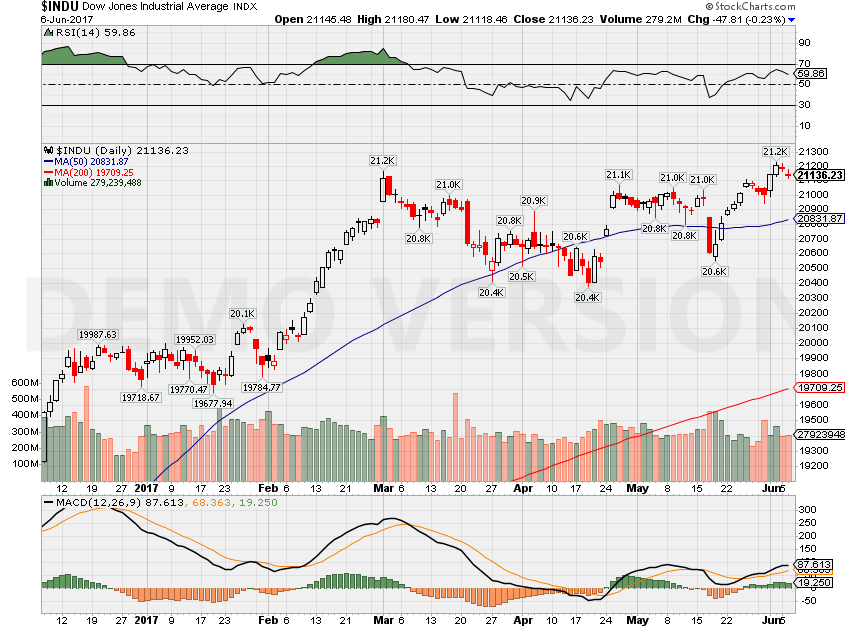
DJIA – Bullish
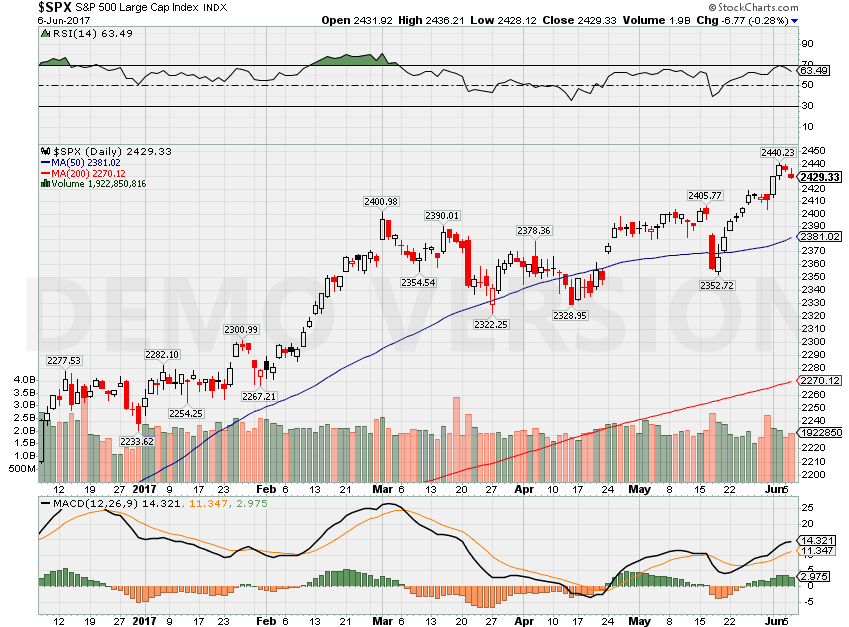
SPX – Hit the RSI Overbought limit line Bullish
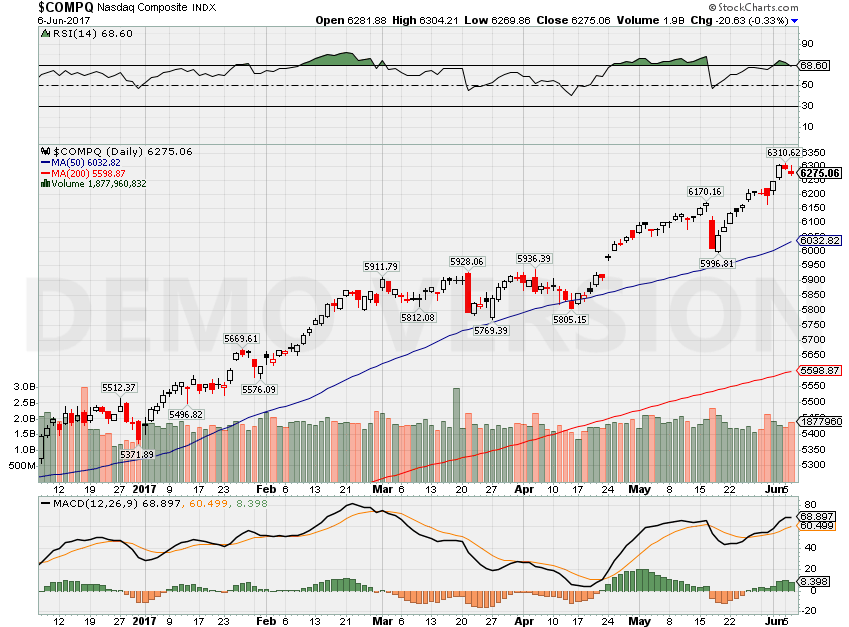
COMP – Overbought bullish
Where Will the SPX end June 2017?
06-06-2017 -2.0%
05-30-2017 -2.0%
What is on tap for the rest of the week?=
Earnings:
Tues:
Wed:
Thur:
Fri:
Econ Reports:
Tues: Jolts
Wed: MBA, Crude, Consumer Credit
Thur: Initial, Continuing Claims,
Fri: Wholesale
Int’l:
Tues –
Wed – JP: GDP, CN: Merchandise Trade, DE: Manufactures Orders
Thursday – ECB Announcement, CN: PPI, CPI
Friday –
Sunday – JP: Machine Orders, PPI
How I am looking to trade?
VIX at 12 to start to try to sell some premium
Looking to sell credit for a sideways moving market – bull puts, short puts and little credit high short calls
Questions???
www.myhurleyinvestment.com = Blogsite
customerservice@hurleyinvestments.com = Email
http://www.cnbc.com/id/104504886
Big market movers: Investors aren’t quite ready to re-pull trigger on Trump Trade
- ETFs took in more than $200 billion in May, led by international equity, and U.S. and overseas bonds.
- International equity is now ahead of U.S. equity in total ETF flows year-to-date — $75 billion versus $68.5 billion
- Many investors stillhave a “pause” button on putting more money into U.S. stocks.
- 39 percent of America’s affluent said they will avoid investing in the next month.
Saturday, 3 Jun 2017 | 12:00 PM ETCNBC.com
It was a good week for the U.S. stock market — at least compared to recent weeks. Even after the “soft” Friday jobs report, the market kept grinding higher, especially big growth stocks, which in the past week saw their biggest inflow in the past four months, according to Bank of America Merrill Lynch data.
Talk of the beleaguered Trump Trade has even been replaced by talk, among some, of a Trump Trade restart.
The Dow Jones Industrial Average saw its first record close since March 1 on Thursday, according to CNBC data. The Dow, S&P 500, NASDAQ, and NASDAQ-100 all closed at record highs on Friday. The small-cap stock Russell 2000 index saw its best daily performance in two months this week.
Financials were the best-performing sector on Thursday, with the Financial Select Sector SPDR (XLF) turning in its best day in more than a month.
But …
… Before turning in a great day on Thursday, financial had given up all their gains for the year as of Wednesday.
And the millionaire investor confidence survey conducted by Spectrem Group showed its biggest ever month-over-month drop in May as 39 percent of America’s affluent said they will avoid investing in the next month.
Before investors take their finger off the Trump Trade pause button, it’s worth taking a look at the biggest trading moves made by investors in May, based on ETF flows data from XTF.com and FactSet. The “animal spirits” argument for the U.S. economy isn’t in full force, but there’s also a risk that the “animal spirits” that moved from the S&P 500 to overseas stocks are just the latest performance-chasing.
1. International stock bets find more outlets.
While it’s an established trend to see international and emerging markets ETFs near the top in flows for equity funds this year, they were the top two ETFs in May, with iShares MSCI EAFE Index ETF (EFA) — roughly $4 billion in May flows — and the iShares Core Emerging Markets ETF (IEMG) — roughly $2 billion in May flows — No. 1 and No. 2 , respectively.
“European economic growth is gaining momentum and political risks have receded. Hopes of reforms and faster economic growth in emerging markets have improved their outlook significantly,” said Neena Mishra, director of ETF research at Zacks Investment Research.
What’s notable is the trend becoming more popular through more targeted bets, said Todd Rosenbluth, director of ETF and mutual fund research at CFRA.
The No. 6 and No. 7 ETFs for new flows in May were the Vanguard FTSE Europe ETF (VGK) and iShares MSCI Eurozone ETF (EZU). “The more targeted bets is a sign of confidence,” Rosenbluth said. And there was a ripple effect from the Macron win in France.
Performance-chasing in overseas ETFs?
| ETF | 1-month return | YTD return |
| EFA | 3.79 | 15.17 |
| IEMG | 2.76 | 18.45 |
| EZU | 5.09 | 19.94 |
| SPY | 1.96 | 9.35 |
XTF.com
International equity is now ahead of U.S. equity in total ETF flows year-to-date — $75 billion versus $68.5 billion, according to FactSet.
In May, U.S. equity ETFs had net flows of $1.5 billion, versus $23 billion for international equity.
“It has as much to do with investors seeking diversification as the U.S. market being near or at record levels,” Rosenbluth said. U.S. investors tend to maintain far greater exposure to the U.S. stock market than international equities.
2. The international investing trend has gotten big in bonds.
International fixed-income ETFs had greater new flows from investors in May than U.S. equities, at $2.25 billion, according to FactSet.
Emerging markets debt was the story, again — it was the 18th straight week of inflows to emerging market debt, according to Bank of America Merrill Lynch data covering the broader universe of fund managers.
The iShares JPMorgan Emerging Markets Bond ETF (EMB) took in $824 million, topped only by two core U.S. bond ETFs in flows for the month.
Marc Faber, author of the “Gloom, Boom & Doom Report” — or Dr. Doom as he is known to market junkies — told CNBC this week that overseas markets have “way outperformed the U.S.” this year, and he believes it will continue. He is favoring European and EM corporate bonds and Treasuries.
3. A big bet on a boring U.S. bond fund shows investor caution.
The iShares iBoxx $ Investment Grade Corporate Bond ETF (LQD) was No. 2 overall in flows among all ETFs for May, not just bond ETFs, at $2.2 billion, after the iShares MSCI EAFE.
U.S. fixed income ETFs had net flows five times the size of U.S. equity flows in May.
On Friday, after the soft jobs report, CNBC’s Jim Cramer said the bond market had been signalling this employment outcome. Yield on the 10-year Treasury hits its 2017 low on Friday.
One of the biggest high-yield bond ETFs was one of the biggest losers among all ETFs in May. The iShares iBoxx $ High Yield Corporate Bond ETF (HYG) saw outflows of near $1.4 billion, shifting its year-to-date flows from being positive to negative overall.
Mishra said the real surprise was that junk bonds, usually highly correlated with oil prices, continued to rally and attract inflows even as the energy sector was the worst performer.
“Inflows out of junk bonds and into investment grade bonds suggest that investors are reducing the U.S. credit risk in their portfolios,” Mishra said.
4. Investors are still betting broadly on U.S. stocks, but waiting for a new catalyst.
Among the Sectors SPDRs —the best market proxy for sector rotation strategies — Consumer Staples (XLP), Consumer Discretionary (XLY), Utilities (XLU), and Industrials (XLI) all saw fresh all-time highs this week, with the Health Care SPDR (XLV) hitting its highest level since 2015. Even the Retail SPDR (XRT) had its best day of 2017.
But in May, instead of a mix of winning and losing sectors, it was a month of little interest in U.S. stock sector bets. Only Consumer Discretionary took in any notable flows — $258 million. The Financial Select Sector SPDR (XLF) saw outflows of $761 million; followed by Technology (XLK), with outflows of $526 million; Consumer Staples, with outflows of $283 million; and Utilities (XLU), with outflows of $249 million.
“It’s notable that only XLY [Consumer Discretionary] of the 10 sectors saw [real] inflows. Investors are not using these products as tactically as they have historically,” Rosenbluth said. “There’s usually net inflows to a handful of sectors, a rotation, and it appears as if investors are going more diversified with their approach in U.S. equities.”
Some of XLY’s top holdings have done well in the past month after better-than-expected earnings. It has more than a 15 percent allocation to Amazon, up more than 6 percent, along with some other top portfolio stocks — Comcast (6.5 percent), McDonald’s (8.8 percent) and Starbucks (6.5 percent).
Mishra said the ongoing political drama in Washington may lead investors to favor larger companies with higher overseas revenue exposure, and these companies have been significantly outperforming smaller, domestically focused companies this year.
“Investors have just been cautious about U.S. stocks. … Investors are just waiting for a new catalyst,” Mishra said.
http://www.cnbc.com/id/104511390
Fast-rising home prices finally hit a wall
- Home values rose a healthy 6.9 percent in April compared with April 2016, according to CoreLogic, but that is a drop from the 7.1 percent annual gain in March and the 7 percent gain in February.
- CoreLogic is also lowering its predictions for annual gains, to 5.1 percent in April 2018.
10 Hours AgoCNBC.com
This spring may be one of the hottest sellers’ markets in history, but even off-the-chart-demand can’t put every potential buyer in a home of their own.
If the house is too expensive for the region’s demand, it won’t sell. That is becoming the case in more and more neighborhoods this spring — and is likely behind the first sign that big price gains are starting to shrink.
Home values rose a healthy 6.9 percent in April compared with April 2016, according to a new report from CoreLogic, but that is a drop from the 7.1 percent annual gain in March and the 7 percent gain in February. CoreLogic is also lowering its predictions for annual gains, to 5.1 percent in April 2018.
“I think we are beginning to see it in selected markets,” said Frank Nothaft, CoreLogic’s chief economist. “You just can’t have house prices grow at 7 percent year after year, when income growth is 2-3 percent a year.”
The evidence is clearest in the hottest markets, like San Francisco, where April home sales were at their slowest pace in six years. The median price hit another new record, but the annual gains are shrinking. Adjusting for inflation, however, San Francisco home prices are still 7 percent below their peak in June 2006.
The higher end of the market is seeing price gains cool the most, because supply there is higher. Both Manhattan and Miami Beach have huge supplies of newly built condominiums, and slower sales are hitting prices. Even in tonier suburbs, the million-dollar-plus homes are sitting longer with more and more price reductions.
Nationally, home prices are reacting to the severe lack of homes for sale, especially on the low end of the market. Demand is heavy, but there is a limit that is slowly being reached in certain markets and even certain neighborhoods. In Washington state, where the supply of homes for sale is at the lowest on record, home prices are up 12 percent annually. In Connecticut, where employment is weakening and major companies have relocated to other states, home supplies are high and prices basically flat.
Those are the extremes. Back in the middle, it’s the same story of short supply and strong demand. If mortgage rates finally do move higher, as some have been predicting, affordability will weaken further. Demand will simply come up against math.
“If we ask young people what are the biggest barriers to home ownership, we’re not getting answers about, ‘Well I’ve run the math and I think that the financial return is greater by putting the money in my IRA or in my 401(k).’ What we get are the economic factors,” Jon Spader, senior research associate with Harvard’s Joint Center for Housing, said at a recent panel discussion at the Department of Housing and Urban Development. “We get responses about building credit history, about saving for a down payment and closing costs, about having sufficient income.”
Rents are also not rising at near the pace of home prices, leaving younger Americans with less incentive to become homeowners. If younger Americans can’t afford to buy, then current homeowners won’t be able to sell and move up the chain. Current homeowners also have less incentive to sell if mortgage rates move up because they’d be giving up the record-low rates of the past few years.
“We have the aspiration to become owners very high, but that dream is not being realized,” said Lawrence Yun, chief economist for the National Association of Realtors, also speaking on the HUD panel.
The affordability pinch will slowly take the heat out of home prices, but even if gains slowed to 5 percent annually, that is still higher than historical norms and still higher than income growth. Homebuilders are not adding tremendous supply right now, especially not affordable supply, so that is unlikely to help in the short term. It could be several years before builders are back up to historically normal levels of production.
http://www.cnbc.com/2017/03/13/the-scary-conversation-about-a-market-crash-thats-being-avoided.html
It’s high time for a blunt conversation about investing and market crashes
Monday, 13 Mar 2017 | 7:50 AM ETCNBC.com
Investors are in for a rude awakening about a coming stock market correction — most just don’t know it yet. No one knows when the crash will come or what will cause it — and no one can. But what’s worse for most investors is they have no clue how much they stand to lose when it inevitably happens.
“If you look at the market historically, we have had, on average, a crash about every eight to 10 years, and essentially the average loss is about 42 percent,” said Kendrick Wakeman, CEO of financial technology and investment analytics firm FinMason.
Many investors have no idea how their portfolios would fare if the equity market took a big hit, according to a risk-tolerance survey FinMason did late last year. Most investors are unaware of the amount of risk in their equity portfolios. As a result, these investors make poor, costly sell decisions at the worst time: when the markets do correct.
“That’s a big problem,” Wakeman said. Most individual reactions to an unexpected loss are much worse than reactions to an anticipated one.
Only 57 percent of investors (both those who have an advisor and those who don’t) said they understand the term risk tolerance. Investors who work with an advisor do know more: 68 percent understand their individual risk tolerance. But working with a financial advisor hasn’t helped as much as it should. Only a little more than one-quarter of those who work with an advisor (27 percent) had been told by the advisor how much their portfolios could lose if there were a market crash.
Of those investors whose advisors had talked to them about a crash, 62 percent believe their loss would be less than what their stated exposure to equities would suggest, the survey found. The survey found that up to 57 percent of clients working with advisors will likely panic and sell in a crash.
“You need to ask your clients, ‘Would you hang yourself in the closet if the market crashed and you lost 35 percent?'”-Kendrick Wakeman, FinMason CEO
The worst-case scenario should be obvious. Long-term portfolio allocation science dictates only a small percentage of assets in cash, so as much as 90 percent to 95 percent of most portfolios are subject to huge short-term losses. Many investors felt this pain after the 2008 market crash, though those who remained invested at the 2008/2009 lows have more than made their money back in the years since — the S&P 500 Index is up 171 percent since the beginning of 2009.
“One of the problems we encountered in 2008 is that many people who were close to retirement also had lots of equity risk but didn’t know about it,” Wakeman said. “So when the market sold off, people panicked and sold and lost their path to retirement. “It’s sad, because you had people who were working and who did all the right things and saved, and now they can’t retire.”
Brandon Corso, director at Edelman Financial Services, said advisors who downplay potential losses are making a mistake.
“The more surprised a client is, the more disappointed they usually are, and that is when they tend to react emotionally,” he said. Corso prefers having a frank discussion with clients about the risk in their portfolio. “You do yourself a disservice if you gloss over it.”
Having a blunt, but not terrifying, conversation
It’s best for advisors to have this conversation in blunt language. How blunt? FinMason’s Wakeman evokes horror stories from the Great Depression.
“You need to ask your clients, ‘Would you hang yourself in the closet if the market crashed and you lost 35 percent?'” If the client says yes, then it’s up to the advisor to help them design a portfolio that would lose less in that scenario, Wakeman said. He added, “It’s the client taking the risk, so they are entitled to know the risk they are taking, and there is no better way to talk about it except in a crash scenario.”
The less math-based the conversation, the better.
“If you say, ‘Over the next six months, we think there is a 95 percent chance that you won’t lose more than 17 percent,’ that’s a legitimate risk metric from a quantitative finance standpoint, but it’s not a good way to explain risk to people with no financial training,” Wakeman said.
John Ndege, CEO of the risk tolerance software provider Pocket Risk, said the time is ripe for advisors to be having this talk with clients. “The only time the markets have seen such a bull run as there has been since 2009 was right before the dot-com crash and before the Depression,” Ndege said. “You need to ask them how secure their job is and do they have enough cash saved for a rainy day.
“You should also check in to see if a client will be able to stomach a collapse, and if there is some kind of recession or downturn, are they ready for it?”
Ndege focuses on two kinds of risk analysis. Risk tolerance involves having a thorough understanding of someone’s psychological risk tolerance and how much of a drop in their portfolio they can handle psychologically before they want to sell. Risk capacity is more objective. It looks at how much the person has saved, the security of their income and whether they will need to withdraw assets any time soon.
The fine line is to have this conversation without scaring the clients.
“The capacity of the U.S. financial markets to adapt and re-price and recover is extraordinary,” said Jim Dowd, CEO of North Capital, a registered investment advisor and investment management firm.
He doesn’t talk to clients about a worst-case scenario, “because the worst case is the one we have not imagined yet,” he said. Instead, Dowd explains to clients that while “there are certain aspects of market collapses or boom bust cycles that do echo each other and are similar, it never happens in the same way, and the catalyst is never the same.”
Dowd said the biggest issue he runs into today is how badly the Great Recession wounded many investors. Clients aren’t taking too much risk in their portfolios; they don’t have enough risk to meet long-term goals. They have large cash positions and are afraid to dip their toes in the water. Inflation and loss of purchasing power make that a big investing problem to solve.
There will likely be periods of time when client accounts fall in value, but that should not be a reason to jump ship if advisors communicate effectively.
“The more we can get clients to ignore what might happen month to month in the market and instead focus on their long-term goals, the better,” said Corso at Edelman.
It’s also a good idea to remind clients about the risk-reward trade-off. “When throwing out a number like a 35 percent loss, you have to also show people that they are taking that risk because they are hoping that it will translate into a gain, which is income in retirement,” said Wakeman of FinMason. “Without talking about the reward component, all that is left is risk aversion, and you end up scaring people at a time when investors need to be looking at building income,” he said.
Wakeman said any advisor who enjoys “keeping clients confused because it gives them an overarching authority” is making a mistake. Clients are becoming more diligent about asking questions rather than blindly trusting their advisors.
“There is a new group of investors out there — millennials — so advisors need to move to a more collaborative conversation because millenials don’t trust anybody,” he said. “Millennials have the time to weather a few market declines. I tell them, ‘By the time you retire, the market will crash three to four times, so get used to it.'”
— By Leslie Kramer, special to CNBC.com
HI Financial Services Mid-Week 06-24-2014