HI Financial Services Commentary 07-10-2018
You tube link: https://youtu.be/gZ37rgsrW2s
What I want to talk about today?
Headline risk environment – Technical’s don’t necessarily matter
200 Billion in Tariffs announced by Trump
How do you trade this type of market?- Difficult but the YOUR rules no longer matter or are applicable
Tech don’t work, Fundamentals take a longer term approach,
You make your best educated guess on what you think the future holds
AS individual stocks broke longer term support I added long puts for earnings – BAC, BIDU, F,
OTHER stocks I added Short Calls – AAPL, DIS, FB, ZION
AND others as the approached support I added short puts – BIDU, UAA, V,
What happening this week and why?
Trump tariffs and travel new trade agreements
Where will our markets end this week?
lower
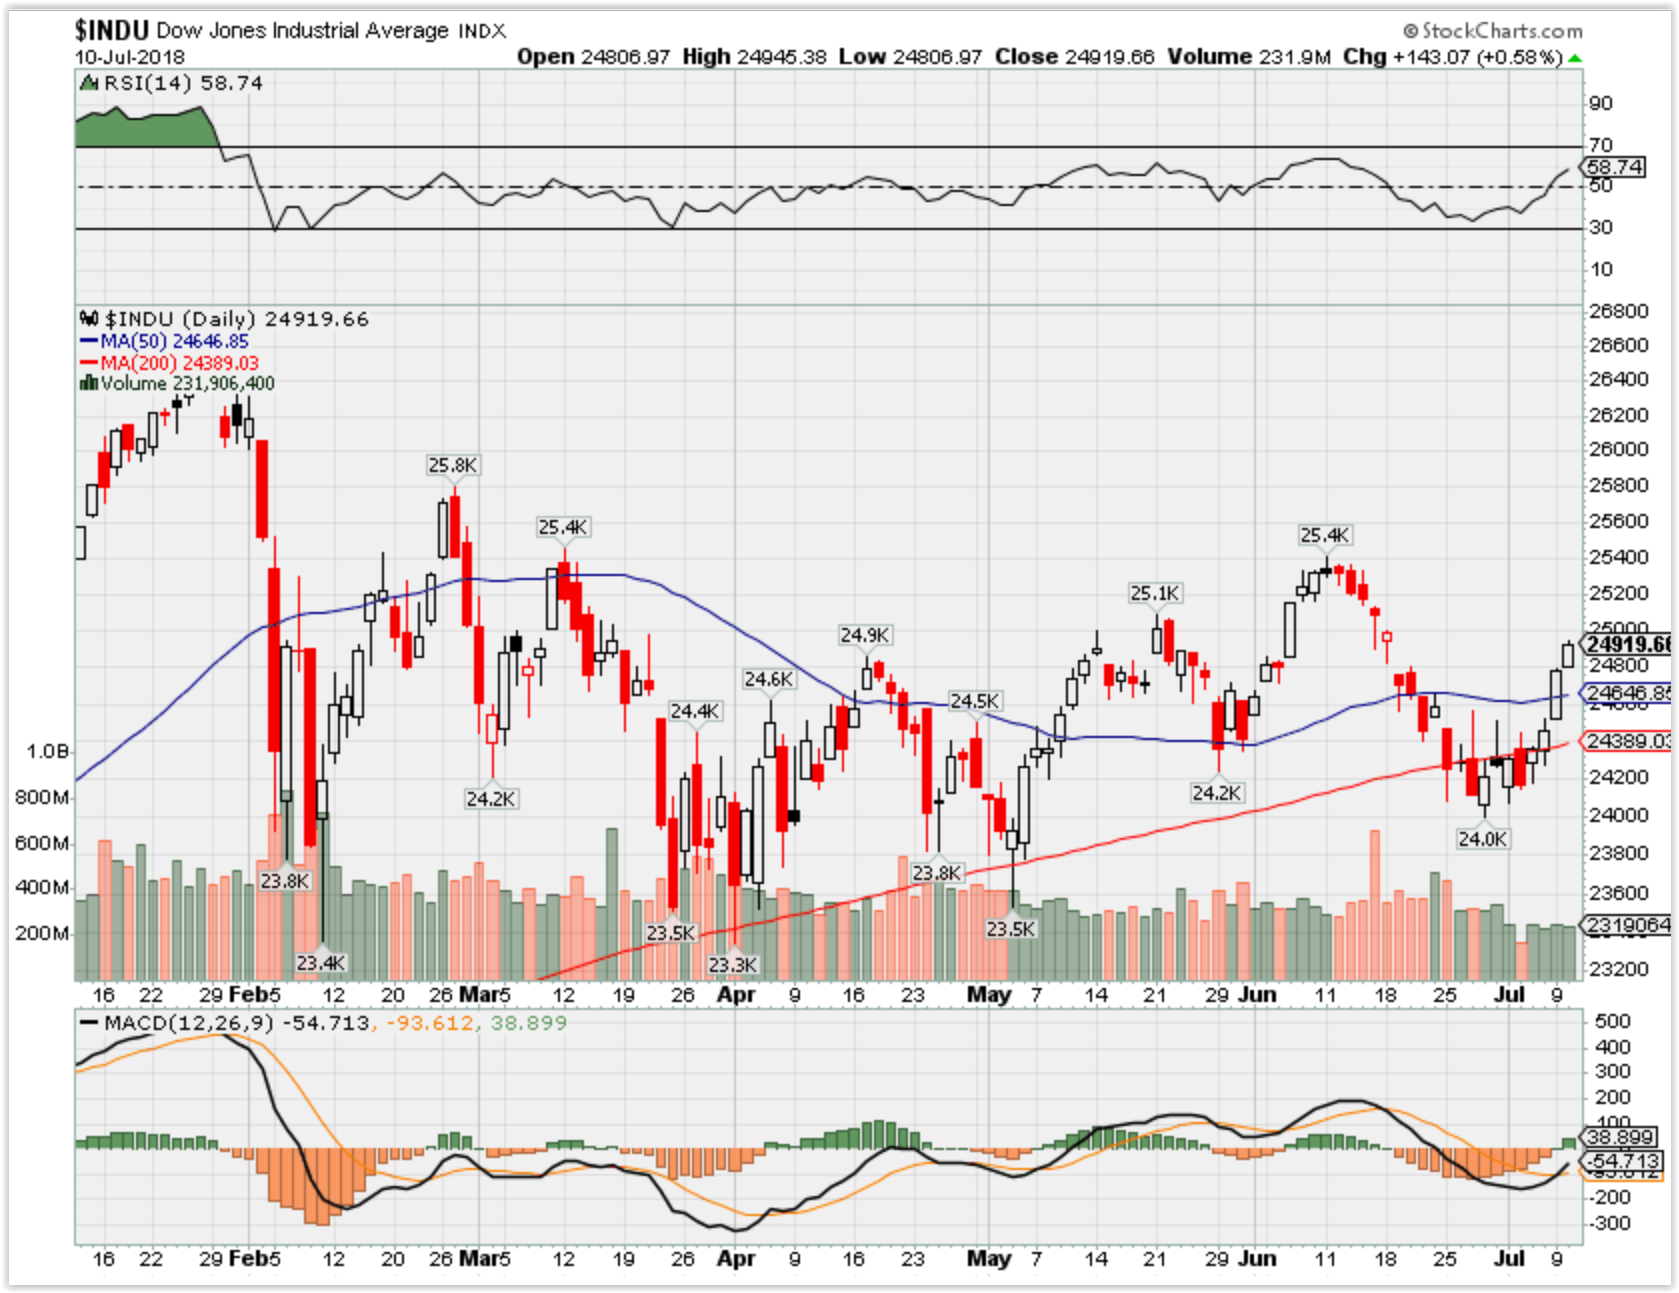
DJIA – Bullish
SPX – Bullish

COMP – Bullish

Where Will the SPX end July 2018?
07-10-2018 +2.0%
06-26-2018 +2.0%
What is on tap for the rest of the week?=
Earnings:
Tues: WDFC, PEP
Wed: FAST
Thur: DAL, DPZ,
Fri: C, JPM, WFC
Econ Reports:
Tues: NFIB Small Business, Jolts
Wed: MBA, Core PPI, PPI, Wholesale Inventories
Thur: Initial, Continuing, Treasury Budget
Fri: Import, Export, Michigan Sentiment
Int’l:
Tues –
Wed –
Thursday –
Friday-
Sunday – CN: GDP, Industrial Production, Retail Sales,
Questions???
www.myhurleyinvestment.com = Blogsite
customerservice@hurleyinvestments.com = Email
How am I looking to trade?
AA – 07/18 AMC
AAPL – 07/31 AMC Most likely have $185 Aug Long puts added tomorrow
AOBC – 09/06
BAC – 07/16 BMO Long puts at $28 OTM
BIDU – 07/26 Already has Aug 250
DIS – 08/07
F – 07/25 AMC Long Puts at $11, 11.50
FB – 07/25 AMC Long Puts at $200
FCX – 07/25 BMO
MO – 07/26
UAA – 07/31 Will most likely add $22 Aug long puts
V – 07/25 AMC Long Puts will be added tomorrow most likely at $135 Aug
ZION – 07/23 AMC Will most likely add 50 or 52.50 long puts Aug 4th week
Just three stocks are responsible for most of the market’s gain this year
- Amazon, Netflixand Microsoft together this year are responsible for 71 percent of S&P 500 returns and for 78 percent of Nasdaq 100 returns.
- Apple also makes up a large portion of both indexes, contributing 12 percent of both S&P 500 and Nasdaq 100 returns, while Alphabet and Facebook contributed 8 percent to each.
Michael Sheetz | @thesheetztweetz
Published 4 Hours Ago Updated 13 Mins Ago
Amazon, Netflix and Microsoft together this year are responsible for 71 percent of S&P 500 returns and for 78 percent of Nasdaq 100 returns.
The three stocks make up 35 percent, 21 percent and 15 percent of S&P 500 returns, respectively, while making up 41 percent, 21 percent and 15 percent of Nasdaq 100 returns.
Apple also makes up a large portion of both indexes, contributing 12 percent of both S&P 500 and Nasdaq 100 returns, while Alphabet and Facebook contributed 8 percent to each.
Both rising rates and President Donald Trump’s tough talk on tradehave weighed on the rest of the stock market this year. For the former, market players fear the struggling equities environment which follows substantial moves in rates. Five months after a rate spike like the one seen in the first quarter, the S&P 500 declines on average by 0.3 percent. The second factor, Trump’s trade talk, has destroyed more than $1 trillion market value so far, according to J.P. Morgan on June 6. The firm highlighted the impact of trade and protectionist ideology as significant market headwinds, which have only continued to escalate.
“Returns reflect markets facing macro uncertainty and tightening financial conditions,” BlackRock global chief investment strategistRichard Turnill wrote in a note Tuesday.
In total for 2018, the six stocks make up 98 percent of S&P 500 returns and 105 percent of Nasdaq 100 returns.
The S&P 500 is up 4.4 percent for 2018, while the Nasdaq 100 is up almost 14 percent.
Companies buying back their own shares is the only thing keeping the stock market afloat right now
- Companies set a record for share buybacks in the second quarter, while investors set their own record for selling stock-based funds in June.
- On the corporate side, officials are finding that repurchases are the best use for investor cash now, while individual investors are fearful that a trade war could offset strong economic momentum this year.
- All in all, the corporate buying has won out, keeping the S&P 500 slightly positive for the year.
Published 11:39 AM ET Mon, 2 July 2018 Updated 7:06 PM ET Mon, 2 July 2018
Stocks right now are hanging by a thread, boosted by a bonanza of corporate buying unrivaled in market history and held back by a burst in investor selling that also has set a new record.
Both sides are motivated by fear, as corporations find little else to do with their $2.1 trillion in cash than buy back their own shares or make deals, while individual investors head to the sidelines amid fears that a global trade war could thwart the substantial momentum the U.S. economy has seen this year.
“Corporate cash is going to find a home, and it’s either going to be in buybacks, dividends or M&A activity. What it’s not going to be is in capex,” said Art Hogan, chief market strategist at B. Riley FBR. “Individuals are looking at the turbulence we’ve seen this year that we had not seen last year. That creates its own sort of exit sign for investors who don’t want to deal with that.”
The numbers showing where each side put their cash in the second quarter are striking.
Companies announced $433.6 billion in share repurchases during the period, nearly doubling the previous record of $242.1 billion in the first quarter, according to market research firm TrimTabs.
Dow components Nike and Walgreens Boots Alliance led the most recent surge in buybacks, with $15 billion and $10 billion, respectively, last week. In all, 31 companies announced buybacks in excess of $1 billion during June.
At the same time, investors dumped $23.7 billion in stock market-focused funds in June, also a new record. For the full quarter, the brutal June brought global net equity outflows to $20.2 billion, the worst performance since the third quarter of 2016, just before the presidential election. The selling is particularly acute in mutual funds, which saw $52.9 billion in outflows during the quarter and are typically more the purview of the retail side.
So far, the market has managed to survive, with a 1.6 percent S&P 500decline in the first quarter offset by a 3 percent gain in the second quarter, leaving the index up about 1.4 percent for the year.
To be sure, there’s a bright side to the pessimism. TrimTabs, in its model portfolio, uses extreme periods of investor sentiment as opportunities to move in the opposite direction, and the firm said it is 100 percent long the S&P 500 now. That comes as bearish sentiment in the American Association of Individual Investors survey hit 40.8 percent last week, a 14.6 percentage point surge and only the second time this year it has eclipsed 40 percent.
Hogan said investors can’t be blamed for an unwillingness to take on more risk even as the economy is turning up. After a typically lackluster 2 percent growth rate in the first quarter, GDP is likely to accelerate by 3.8 percent in the second quarter, according to CNBC’s Rapid Updatetracker of economic forecasts.
“What’s happening is you get an environment where trade policy becomes an economic negative in the second half of this year,” he said. “Certainly if your risk tolerance is lower, then hitting the exit is probably the right thing to do.”
Corporate behavior is helping offset that fear, but that has a catch.
The 2017 tax cuts that lowered the nominal rate most companies pay from 35 percent to 21 percent also provided incentives to bring back profits stored overseas and gave breaks for companies investing in capital. However, a big chunk of corporate cash appears headed to shareholders.
In addition to the buyback surge, companies issued a record $111.6 billion in dividends during the second quarter, bringing the 2018 total to $220.8 billion, a 7.8 percent increase over the same period a year ago, according to Howard Silverblatt, senior index analyst at S&P Dow Jones indices. M&A activity also is surging, with dollar volume for the three months ending May 31 at $726.3 billion, more than doubling the same period in 2018, FactSet reported.
Capital spending, though, is expected to rise at more modest pace — 6.6 percent in 2018 and 5 percent in 2019, according to mid-June estimates from The Conference Board.
So while companies are likely to continue to prop up the market by returning cash to shareholders, it comes against a backdrop of concern that there simply may be no better place to put money amid the trade uncertainty.
“It just doesn’t appear that we’re close to an end on the trade issue,” Hogan said. “That’s going to present a significant headwind to this market until it doesn’t.”
https://seekingalpha.com/article/4184773-facebook-remarkable-bargain-plain-sight
Facebook: Remarkable Bargain In Plain Sight
Jun. 29, 2018 1:08 PM ET
Summary
Facebook’s stock has surged by about 33% since the buying opportunity following the Cambridge Analytica scandal. But despite the run-up Facebook remains very cheap.
The company is set to expand revenues nearly 10 fold, from $7.8 billion in 2013 to an estimated $72 billion in 2019, an average annual growth rate of about 50%.
The company also has various businesses capable of securing significant user growth going forward, and Facebook essentially has a monopoly in social networking.
Despite the company’s remarkable growth and dominant market position the stock is currently trading at only 20 times next year’s earnings, possibly even cheaper.
This suggests Facebook shares have significant upside potential from here, likely about 50% over the next year.
Source: AdvicesAcademy.com
Facebook: Remarkable Bargain In Plain Sight
Facebook (FB) has staged a formidable rally since the Cambridge Analytica scandal. In fact, a move from the $150 level to $200 represents an impressive 33% surge in fewer than 3 months. But despite the recent run-up in the stock Facebook shares still seem inexpensive in relation to the company’s explosive growth prospects.
Source: StockCharts.com
Facebook enjoys a dominant global position in social networking, has illustrated a 50% revenue growth rate over the past several years, and currently trades at just 20 times next year’s consensus earnings estimates. Moreover, the company often surpasses earnings estimates, and forward looking revenues as well as income projections appear to be on the light side. Therefore, Facebook could very well be trading below 20 times next year’s earnings, while revenues are set to expand at 40-50% this year, which implies the stock is very
Investors are yanking money out of global stocks at levels not seen since the 2008 financial crisis
- Investorspulled $12.4 billion from global stock-focused funds in June, the highest level since October 2008 amid the worst of the financial crisis.
- A slowing global economy is spooking some investors as are fears of a trade war.
- Emerging market stocks soared in 2017 but have slumped in 2018, adding to the outflow of investor cash.
Published 12:16 PM ET Thu, 28 June 2018 Updated 1:11 PM ET Sat, 30 June 2018
Investor money is hemorrhaging out of global stock funds at a pace not seen since just after the financial crisis exploded.
Global equity funds have seen outflows of $12.4 billion in June, a level not seen since October 2008, according to market research firm TrimTabs. Lehman Brothers collapsed in September of that year, triggering the worst economic downturn since the Great Depression and helping fuel a bear market that would see major indexes lose more than 60 percent of their value.
The most recent exodus, which includes exchange-traded and mutual funds, comes amid worries that the much-touted synchronized global expansion is running out of gas, as well as some unwinding of what had been a hugely successful trade in emerging market stocks.
The iShares MSCI Emerging Markets ETF, which tracks the group, surged more than 18 percent in a five-month span from July 2017 to January 2018, but has given back a big chunk of those gains in 2018 and is down about 10.3 percent year to date. By comparison, the S&P 500has risen nearly 1 percent during a volatile 2018, while the Vanguard FTSE All-World ex-US Index Fund, which tracks global equities minus the U.S., is off more than 6.5 percent this year.
As the emerging market and non-U.S. trade has unwound and fears have intensified over a trade war, investors have fled global stocks and returned to the U.S., where funds have seen $6.3 billion in inflows. The iShares emerging market ETF has seen $5.4 billion in outflows in June, the most of any fund, according to ETF.com.
“U.S. dollar strength and persistent underperformance seem to be driving fund investors away from non-U.S. equities,” TrimTabs said in a note.
Interestingly, one of the regions suffering the lowest level of investor fear is China, where funds have seen a net inflow of $150 million even though the nation’s main stock index has plunged into a bear market, defined as 20 percent below its most recent high.
For investors, then, the main question may be whether the outflows elsewhere are signaling something more ominous or are merely setting up another buying opportunity as valuations get cheaper.
“Cumulative flows for the year [across asset classes] are still up [thanks] to strong inflows in January. Russia and [South] Africa are now driving the outflows, as the most crowded markets at the eve of recent weakness,” Gabriele Foa, cross asset strategist for emerging markets at Bank of America Merrill Lynch, said in a note. “Selected opportunities are emerging thanks to weak levels.”
In fact, if the trend holds up through the end of June, it will make the first time global equities have seen net outflows since November 2016, according to TrimTabs.
Investors, however, remain bullish on Latin America, which has seen $30 million in inflows to ETFs in June even though the funds have lost 10 percent in June and more than 25 percent since May.
https://www.cnbc.com/2018/06/22/all-35-times-markets-did-this-stocks-ended-the-year-higher.html
All 35 times the market rose into summer, stocks ended the year higher
Summer just started and history suggests a sunny forecast. In the 35 times since 1950 when the S&P 500 rose at least 3 percent heading into the first day of the season, the full year was positive every time.
That trend will stretch into a 36th year, according to Mark Tepper, president of Strategic Wealth Partners.
“We’re still overweight stocks at the expense of bonds and we really do expect to hold that positioning at least until the end of the year before we would potentially downshift to neutral,” Tepper told CNBC’s “Trading Nation” on Thursday. “Our research says absolutely no recession until 2020, so it does make sense to stay overweight stocks right now.”
The S&P 500 should end the year at around 2,900, predicts Tepper. Those levels imply a 5.5 percent rise from current levels and would see the S&P 500 end 2018 with full-year gains of 8.5 percent. The benchmark index came close to 2,900 at its record-making peak in late January.
This march to 2,900 won’t be a straight shot, Tepper warns.
“As there’s all this trade war talk going on, as long as that’s a concern, I think the market is going to trade within a range, and I would expect that to really persist through the end of the summer,” said Tepper. “I wouldn’t expect any significant upside until all of this stuff calms down.”
Market fears over a brewing trade war between the U.S. and China have hit stocks this week. The S&P 500 was up just over 3 percent heading into June 21, although it is down 1 percent for the week and on track for its worst week since March. Worries pushed the Dow into negative territory for the year.
Matt Maley, equity strategist at MillerTabak, says the Federal Reservecould introduce larger market tremors than trade worries.
“Every Fed tightening cycle, it has always caused disruptions in the stock market and a slowdown in the economy,” Maley said Thursday’s “Trading Nation.” “It didn’t always cause a recession but it usually did and it didn’t always cause a bear market but it usually did.”
The aftershocks of tighter monetary policy are beginning to be felt on markets, says Maley, and those fissures could widen.
“We saw it in the short-vol trade, then we saw it in emerging markets, and then we saw it in southern Europe, now we’re seeing it in European banks,” said Maley. “Eventually this thing kind of all spills over and eventually hits the U.S. markets, so I’m concerned we’ll see another pullback into correction territory.”
The S&P 500 is currently 4 percent lower than its 52-week high set on Jan. 26, far from the more than 10 percent decline required for a correction. To be at that level, the S&P 500 would need to drop to at least 2,585.
HI Financial Services Mid-Week 06-24-2014