
HI Financial Services Commentary 07-31-2018
You Tube Link: https://youtu.be/m0XTb4e3UwQ
What I want to talk about today?
Earlier this year, I begin penning a series on the technical indicators we use in much of our analysis, both in these weekly “Technically Speaking” posts and in our weekly Real Investment Reports. While we often discuss what these signals are indicating, there are often questions involving exactly what these indicators are measuring.
Technical analysis is often dismissed by investors for three reasons:
- A lack of understanding of exactly what technical analysis is,
- An inability to properly apply technical analysis to portfolio management, and;
- The media narrative that “technical analysis” doesn’t work.
There is no “one method” of technical analysis that works for everyone. Every technician uses different methods, indicators, and time-frames for their own analysis. Much depends on your personal investment time frame, risk tolerance and investing behavior.
These articles are an attempt to clearly define some of the more common technical indicators we use in our own portfolio management practice and how we apply them.
(Note: we will be providing our specific methods of technical analysis, indicators, etc., in our forthcoming premium section of Real Investment Advice. Click here for pre-subscriptioninformation.)
We are going to continue our journey with the Williams %R Index.
What Is Williams %R
Accordingly to Stockscharts.com:
“Developed by Larry Williams, Williams %R is a momentum indicator that is the inverse of the Fast Stochastic Oscillator. Also referred to as %R, Williams %R reflects the level of the close relative to the highest high for the look-back period. In contrast, the Stochastic Oscillator reflects the level of the close relative to the lowest low. %R corrects for the inversion by multiplying the raw value by -100. As a result, the Fast Stochastic Oscillator and Williams %R produce the exact same lines, only the scaling is different. Williams %R oscillates from 0 to -100. Readings from 0 to -20 are considered overbought. Readings from -80 to -100 are considered oversold. Unsurprisingly, signals derived from the Stochastic Oscillator are also applicable to Williams %R.”
Why do we care about that?
As I have written previously:
“Market downturns are an ’emotionally’ driven imbalance in supply and demand. You will commonly hear that ‘for every buyer, there must be a seller.’ This is absolutely true. The issue becomes at ‘what price.’ What moves prices up and down, in a normal market environment, is the price level at which a buyer and seller complete a transaction.
The problem becomes when the ‘buyer at a higher price’ fails to appear.”
The same goes for “buying stampedes” as well.
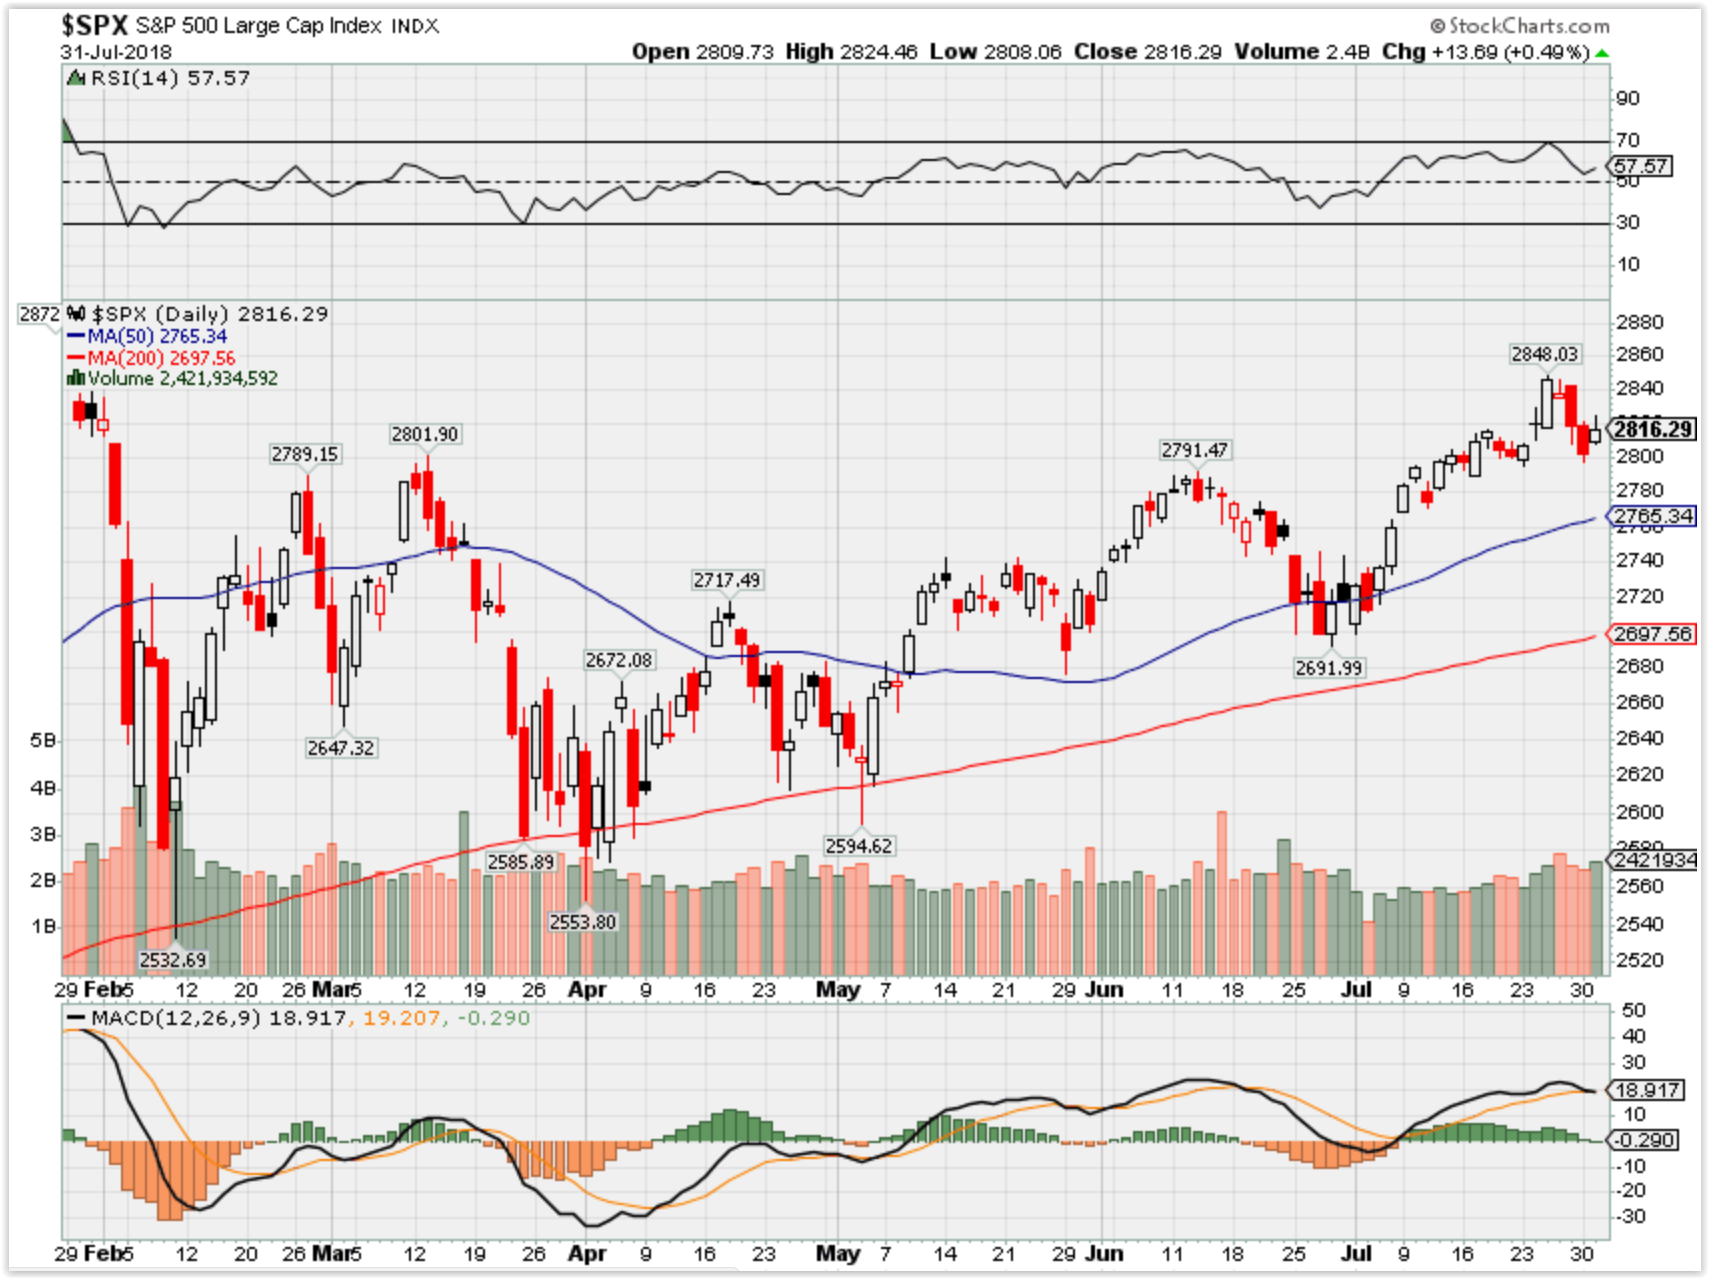
At some point, buyers and sellers reach a point of “exhaustion” or more commonly termed “overbought” or “oversold” conditions. This is simply the point at which buyers are unwilling to pay “higher” prices, or sellers are unwilling to accept “lower” prices. Historically, these “overbought” and “oversold” conditions have represented better “entry” or “exit” points for investment capital. The chart below shows the S&P 500 index overlaid with the 14-week Williams %R indicator.
The Williams %R is calculated using the following formula:
%R = (Highest High – Close)/(Highest High – Lowest Low) * -100
Where:
- Lowest Low = lowest low for the look-back period
- Highest High = highest high for the look-back period
- %R is multiplied by -100 correct the inversion and move the decimal.
Here is a table of the calculation used for the chart above.
The “average” number of periods, usually 14-periods (minutes, hours, days, weeks, months), can be any length of period chosen by the investor. The longer the “average” the “slower” the movement of the index. This is where it becomes important to “marry” the duration of the index to your investment horizon. Since our portfolios are “long-term” in nature, our example uses a 14-period weekly chart (3-months).
As noted by Stockcharts:
“As a bound oscillator, Williams %R makes it easy to identify overbought and oversold levels. The oscillator ranges from 0 to -100. No matter how fast a security advances or declines, Williams %R will always fluctuate within this range. Traditional settings use -20 as the overbought threshold and -80 as the oversold threshold. These levels can be adjusted to suit analytical needs and security characteristics. Readings above -20 for the 14-day Williams %R would indicate that the underlying security was trading near the top of its 14-day high-low range. Readings below -80 occur when a security is trading at the low end of its high-low range.
It is important to note that overbought readings are not necessarily bearish. Securities can become overbought and remain overbought during a strong uptrend. Closing levels that are consistently near the top of the range indicate sustained buying pressure. In a similar vein, oversold readings are not necessarily bullish. Securities can also become oversold and remain oversold during a strong downtrend. Closing levels consistently near the bottom of the range indicate sustained selling pressure.”
Williams %R is a “tool” that can be used to help identify better entry or exit points for investor capital. However, like any tool, if used improperly it will provide poor results. It is for this specific reason that most investors deem “technical analysis” to be nothing more than “voodoo” and disregard it entirely.
But should you?
As Stockcharts notes:
“Like all technical indicators, it is important to use the Williams %R in conjunction with other technical analysis tools. Volume, chart patterns and breakouts can be used to confirm or refute signals produced by Williams %R.”
This is absolutely correct.
The reason that technical analysis fails most investors is that their investment time horizon exceeds the time-frame of the analysis. For example, most investors are investing capital to perform with the market over the forthcoming year which is why “benchmarking” is so widely adopted. However, they then utilize very short-term (hourly or daily) analysis to manage their portfolio. This “duration mismatch” leads to technical signals that create “bad” entry/exit points for investors more commonly known as “whipsaws” or “head fakes.”
In our own practice, our portfolios are designed for longer-term holding periods. Therefore, outside of short-term trading opportunities, we are more interested in the overall “trend” of the market. Our major concern is a more “major” change in the overall trend that could lead to large losses of capital during the portfolio investment horizon. This is why our focus is primarily on weekly and monthly, and even quarterly, measures which provide a better “match” to our overall investment goals.
There Is Not Just One
There is no indicator that is an “absolute.” Since markets are driven largely by emotion, large price movements can create “false” buy or sell signals in a price based indicator.
“One can’t simply use a single metric to manage risk in their retirement portfolio. It takes a suite of indicators, observing them all in unison, and making buy and sell decisions based on the weight of the evidence at hand.” – Adam Koos
This is why all indicators perform the best when:
- Used in conjunction with other, confirming technical indicators,
- Periods and duration are matched to investment horizons,
- Combined with the overall investment discipline (buy/sell strategy), and;
- Utilizes the K.I.S.S. principle (Keep It Simple, Stupid)
The two biggest problems that investors run into when trying to implement technical analysis into their portfolio management are:
- Using too many different indicators which create contradicting signals which leads to investment “paralysis.”
- A lack of a “buy” and “sell” discipline which corresponds to the technical signals being given. Any portfolio management process is only as good as the investor discipline to adhere to it.
Currently, with the Williams %R index starting to register an overbought condition, it suggests the current advance in the market is getting a bit stretched. This doesn’t mean one should sell everything and go to cash. However, as I noted this past weekend:
“In the intermediate-term, the market is moving back to rather extreme overbought conditions. The market can most assuredly get even more overbought from current levels, but does suggest that upside is becoming more limited from current levels. However, with the weekly ‘buy signal’ triggered this past week, we must give the bulls some room to run.”
“With our portfolios nearly fully allocated, there is not a lot of actions we need to take currently as the markets continue to trend higher for now. We will continue to monitor our exposure and hedge risk accordingly, but with the weekly “buy signal” registered we are keeping our hedges limited and are widening our stops just a bit.”
Technical analysis IS NOT some “black box” approach to portfolio management. However, what technical analysis does provide is a method to extract “emotion” from the “buy/sell” process. For us, the fundamentals dictate WHAT we “buy” and “sell” in portfolios, but it is the technicals that drive the WHEN those decisions are implemented.
You may not agree with our methods, but it is what works for us in our process. I hope you find it useful to yours.
Lance Roberts
Lance Roberts is a Chief Portfolio Strategist/Economist for Clarity Financial. He is also the host of “The Lance Roberts Show” and Chief Editor of the “Real Investment Advice” website and author of “Real Investment Daily” blog and “Real Investment Report“. Follow Lance on Facebook, Twitter and Linked-In
What happening this week and why?
What’s on my mind? FB and where I am at!!!
Where will our markets end this week?
Higher due to AAPL
DJIA – Bullish 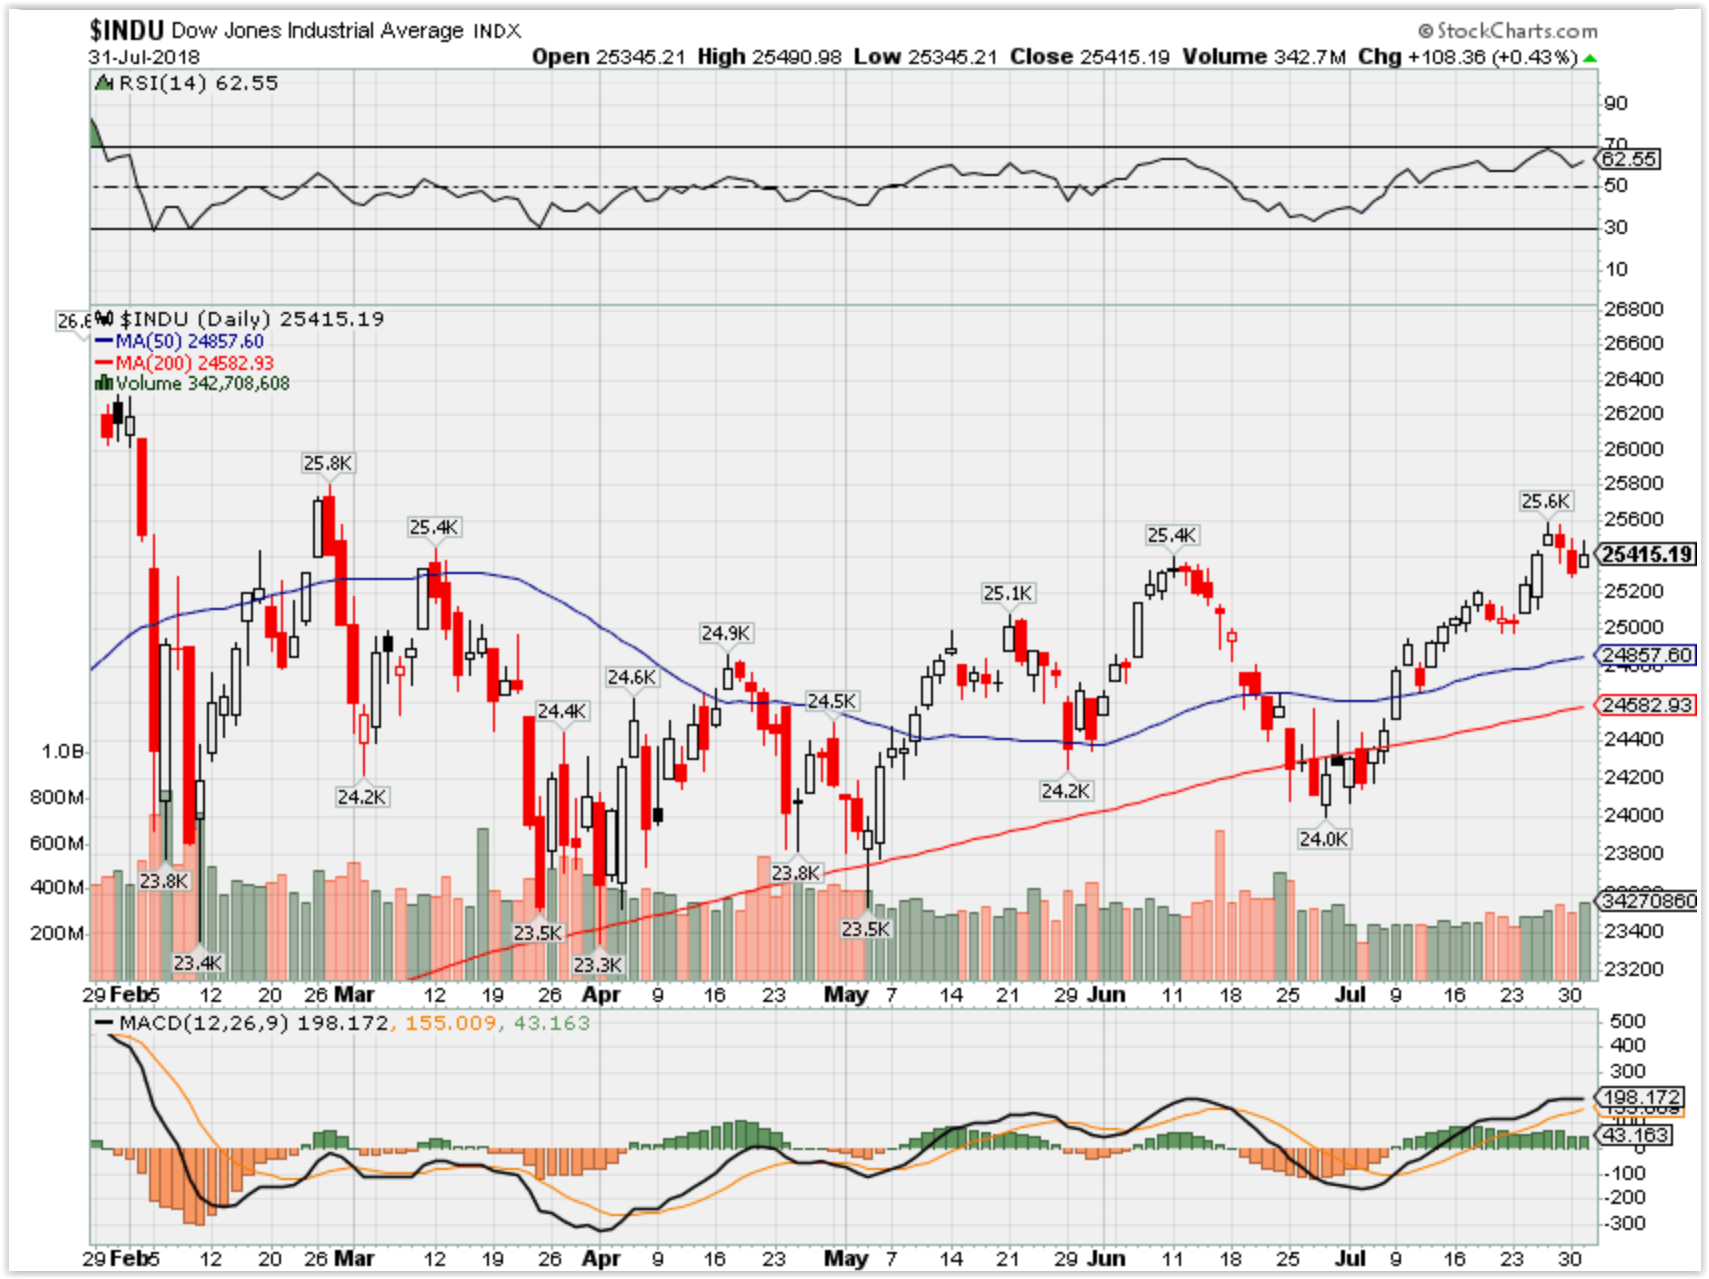
SPX – Bullish
COMP – Bearish

Where Will the SPX end August 2018?
07-31-2018 -2.0%
Earnings:
Tues: BP, CMI, JCI, PFE, PG, RL, AKAM, DVN, GNW, MDL, AAPL, BIDU, PZZA
Wed: FIT, HLF, MRO, SQ, TMUS, X, ZNGA, HUM, TAP, S, SODA, SSTK, CF
Thur: DUK, K, MGM, YUM, CBS, FLR, GPRO, NUS, SHAK, TSRO
Fri: DISH, KHC, NBL
Econ Reports:
Tues: Employment Cost Index, PCE Prices, PCE Core, Personal Income, Personal Spending, Case-Shiller, Chicago PMI. Consumer Confidence
Wed: MBA, ADP Employment, Construction Spending, ISM Index, FOMC Rate Decision, Auto, Truck
Thur: Initial, Continuing, Factory Orders
Fri: Average Workweek, Non-Farm, Private, Hourly Earnings, Unemployment Rate, ISM Service, Trade Balance
Int’l:
Tues –
Wed –
Thursday –
Friday-
Sunday –
How am I looking to trade?
IN protective puts or collar trades for earning
AAPL beat earnings
$2.34 vx est $2.18
53.27B vs est 52.34
41.3 m iphone sold vs 41m BUT ASP $724 which means more people are buying the iphone X at the higher price which means more revenue for AAPL
60% growth in wearables – Iwatch, Ipods, Ibuds
Services 9.55B vs est 9.21 B and cook said on pace to be a 14Billion a quarter revenue
Forward guidance 60-62 vs est 59.47 = means Sept release of a new phone
1 billion transactions last quarter
BIDU and DIS should also follow suit
www.myhurleyinvestment.com = Blogsite
customerservice@hurleyinvestments.com = Email
Questions???
Morgan Stanley: The biggest sell-off since February is coming and it’s going to hit the average investor hard
- Morgan Stanley predicts the market will drop further with technology and consumer stocks faring the worst.
- “The weaker earningsbeat from several Tech leaders and outright misses from Netflix and Facebook were simply additional support for our [defensive] call,” chief U.S. equity strategist Michael Wilson says.
- The “average portfolio” will suffer more because the selling will be concentrated in tech, consumer and small cap shares, the firm says.
Published 2 Hours Ago Updated 32 Mins Ago
Morgan Stanley believes the dramatic drops in some high-flying technology stock this is month is further evidence the stock market will go lower.
“The weaker earnings beat from several Tech leaders and outright misses from Netflix and Facebook were simply additional support for our [defensive] call,” chief U.S. equity strategist Michael Wilson said in a note to clients Monday.
And the average investor could suffer even more this time, Wilson said.
“We think a coming correction will be biggest since February, although it could very well have more of a negative impact on the average portfolio if it is centered on Tech, Discretionary, and small caps,” the note said.
Facebook shares dropped 19 percent last Thursday, a day after it reported lower-than-expected second-quarter sales and daily active user numbers, resulting in the biggest one-day market value loss for a single U.S. stock in history. Netflix shares declined 14 percent this month through Monday after the streaming giant missed subscriber expectations for its second-quarter on July 16.
Wilson noted the relative valuation between growth and value stocks was only higher during the dot-com bubble. He also pointed out that the 10-year return disparity between the Russell 1000 Growth index over the Russell 1000 Value index is at its 96th percentile since 1980.
“Large Cap Growth stocks have outperformed US Large Cap Value stocks by an almost unprecedented amount over both the recent past and prior decade,” he said. “Fighting momentum is a difficult game but when you time it right, it can very profitable. We think one of those times is now for Growth shifting to Value.”
The S&P 500 fell more than 10 percent from its highs in late-January through early February as investors reacted to a stronger-than-expected jobs report and wage number, sparking concerns over future rising interest rates.
In comparison, the market is down about 1.5 percent from its monthly high on Wednesday through Monday. The strategist reiterated his 2,750 12-month target for the S&P 500, representing 2 percent downside to Monday’s close.
Wilson reaffirmed his overweight ratings for utilities, energy, industrials and financials sectors, which should outperform in a more difficult market environment, he said.
Earlier this month the strategist turned defensive on the market, downgrading small-cap stocks to equal weight and lowering his rating for technology stocks to underweight. In 2017, Wilson was one of the most bullish strategists on Wall Street.
The market is dealing with something it’s never seen before and that has Jamie Dimon worried
- Central banksaround the world are starting to reverse course after a decade of nursing economies back to health by buying up trillions of dollars worth of bonds.
- The market had never seen this bond-buying activity, called quantitativeeasing, and has also never witnessed a period of time when it is being reversed. That could mean uncertainty.
- P. Morgan’s Jamie Dimon has been consistently optimistic about the strength of the U.S. economy.
Published 17 Hours Ago Updated 3 Hours AgoCNBC.com
Jamie Dimon, chairman and chief executive officer of J.P. Morgan Chase, is bullish on the U.S. economy, which is in the latter stages of one of the longest expansions in history.
But when asked Monday on CNBC’s “Closing Bell” what the single biggest risk to the economy is, Dimon had two answers. First, the U.S. trade dispute with China, if it escalates into a full-blown war, would erase much of the progress the Trump administration has made, he said.
And then there’s the unwinding of unprecedented efforts by central banks around the world a decade after the 2008 financial crisis. Dubbed “quantitative easing,” the Federal Reserve and other central banks purchased trillions of dollars of government bonds and other securities to help nurse the economy back to health. They are now starting to reverse course. Dimon told CNBC that he is concerned about what happens when that support is pulled back.
“I don’t want to scare the public, but we’ve never had QE,” Dimon said. “We’ve never had the reversal. Regulations are different. Monetary transmission is different. Governments have borrowed too much debt, and people can panic when things change.”
Dimon, 62, has also previously warned of the possibility that the Fed will have to hike interest rates faster than expected, slamming the brakes on growth. The recurring theme: policymakers are in uncharted waters. Adding to the risk is the fact that the administration is looking at imposing another round of tariffs on $200 billion in Chinese goods. Dimon said Monday that he told the administration that he and other business leaders disagreed on the tactics, but that President Donald Trump “obviously doesn’t agree with us.”
Dimon is the longest tenured of CEOs leading a major U.S. bank. Once his friend, Goldman Sachs’ Lloyd Blankfein, steps down in October, he will also be the only bank CEO still working to have steered his firm through the financial crisis. Given Dimon’s record, investors and analysts often track his every word, from media appearances to conferences to his annual investor letter.
Dimon said Monday that he and J.P. Morgan’s board believes there are several executives who could eventually succeed him as CEO in about five years.
Apart from the trade dispute and QE unwind, Dimon has been consistently optimistic about the strength of the U.S. economy and the prospects for banks. During a conference call with analysts this month after posting record second-quarter profit of $8.32 billion, he said there weren’t a lot of things out there that could derail growth, which has been accelerating.
“Finally, people are going back to the workforce,” Dimon said. “The consumer balance sheet is in good shape. Capital expenditures are going up. Household formation is going up. Homebuilding is in short supply. The banking system is very, very healthy compared to the past.”
The S&P 500 is now just 2% from a record and tech earnings could push it over the top
Published 8:06 AM ET Thu, 19 July 2018 Updated 8:45 AM ET Thu, 19 July 2018
Stocks have been in a slow-motion melt-up for the past couple weeks. What will it take for the market to hit new highs?
The S&P 500 index has risen eight of the last ten trading sessions, up 3.7 percent, to the highest level since late January. It’s now only two percent from the historic high in January (2,872). The NASDAQ-100 index is already at an historic high.
Traders believe three main factors have been helping markets recently and need to continue to pass the old historic S&P historic high of January:
1) Earnings not just beating expectations, but guidance remaining strong
“Corporate fundamentals are fine, and that is translating into very good results,” Alec Young, Managing Director of Global Markets Research at FTSE Russell, told me. Early signs are encouraging. With 10 percent of the S&P reporting, earnings for the second quarter are up 25 percent for those that have reported, well above expectations of a gain of 21 percent for the overall S&P. Guidance for the third quarter remains strong. Recently, United Airlines, Textron, WW Grainger, and CSX all beat and raised guidance (CSX raised revenue guidance).
2) Keeping rates and inflation under control
The markets rose on both days during Federal Reserve Chairman Jay Powell’s testimony, where Powell gave an upbeat assessment of the U.S. economy and said he expected inflation to remain near its 2 percent target, and that “for now, the best way forward was to keep gradually raising the Federal Funds rate.” Traders took this to mean that Powell had no intention of being overly aggressive and that if economic conditions worsened the Fed would simply stop raising rates.
3) Trade concerns lessening
“The earnings season indicates that the combination of tax cuts and a strong economy are clearly more powerful than trade worries,” Young told me. “The size of the tax cuts and other fiscal stimulus dwarfs tariffs by 7 to 1, helping explain why stocks have been increasingly impervious to trade worries as earnings and economic data generally surprise to the upside.”
What could go wrong with this scenario?
They key will be technology earnings. Tech is 26 percent of the weighting in the S&P 500, and Christine Short from Estimize told me they are looking for 25 percent earnings growth and 15 percent revenue growth in technology alone.
“We are still looking for a big spending upcycle for the rest of the year in technology,” she said.
She will be watching a small group of what she says are tech bellwethers: Microsoft and Skyworks after the close Thursday, followed by Google (Alphabet) on Monday; Texas Instruments on Tuesday; AMD, Facebook, Visa, and Paypal on Wednesday; Intel and Mastercard on Thursday; and Electronic Arts and Baidu on Friday.
David Einhorn: Hedge fund’s performance ‘far worse than we could have imagined’
- Greenlight Capital lost 5.4 percent in the second quarter, bringing the performance of its funds to a year-to-date loss of 18.3 percent, according to a letterobtained by CNBC.
- David Einhorn says over the last three years, Greenlight’s fund performance has been “far worse than we could have imagined, and it’s been a bull marketto boot.”
- Value investing has been out of style as investors flock to growth stocks, but Einhorn says he believes the trend will eventually reverse.
Published 3 Hours Ago Updated 1 Hour Ago
Amid a bull market in equities, billionaire hedge fund manager David Einhorn has performed poorly and admits it’s been “far worse” than he could have imagined.
His hedge fund firm, Greenlight Capital, lost 5.4 percent in the second quarter, bringing the performance of its funds to a year-to-date loss of 18.3 percent, according to a letter obtained by CNBC. The S&P 500gained 2.6 percent this year as of the end of June.
“Over the past three years, our results have been far worse than we could have imagined, and it’s been a bull market to boot,” Einhorn wrote in the letter to investors. “Yes, we have made some obvious mistakes – the worst of which was not assessing that SunEdison was a fraud in 2015 – but there have been others. A number of years ago one of our investors said Amazon would surpass Apple and become the most valuable company in the world. We didn’t get it then and, truthfully, we don’t really get it now.”
The letter acknowledges that an unspecified number of investors have lost patience and sold out of the funds.
The manager points to a number of stumbles, including investments in Brighthouse Financial, a MetLife spinoff, as well as General Motors, two of its larger positions. The letter said Greenlight had taken action “to mitigate our problems.” It covered its Netflix equity short position at $281.46 as the stock climbed to $391.43 during the second quarter. And it traded its Athenahealth short position so that it has not been a material loser this year, he said.
Einhorn said that others have theorized that age, changed lifestyle or an unwillingness to adapt to shifting markets was the cause of his funds’ underperformance. Part of the reason, though, is that his focus on value investing — buying stock of out-of-favor companies — has struggled as growth company stocks have surged.
He notes in the letter that the Russell 1000 Pure Growth index has outperformed the Russell 1000 Pure Value index by 54 percent.
That should eventually reverse, he wrote.
“Right now the market is telling us we are wrong, wrong, wrong about nearly everything,” Einhorn wrote. “And yet, looking forward from today we think this portfolio makes a lot of sense.”
HI Financial Services Mid-Week 06-24-2014