HI Financial Services Commentary 09-18-2018
YouTube Link: https://youtu.be/NQjTTOKkhsE
What I want to talk about today?
Why can’t anyone seem to understand the current risk in the market and what are the signals?
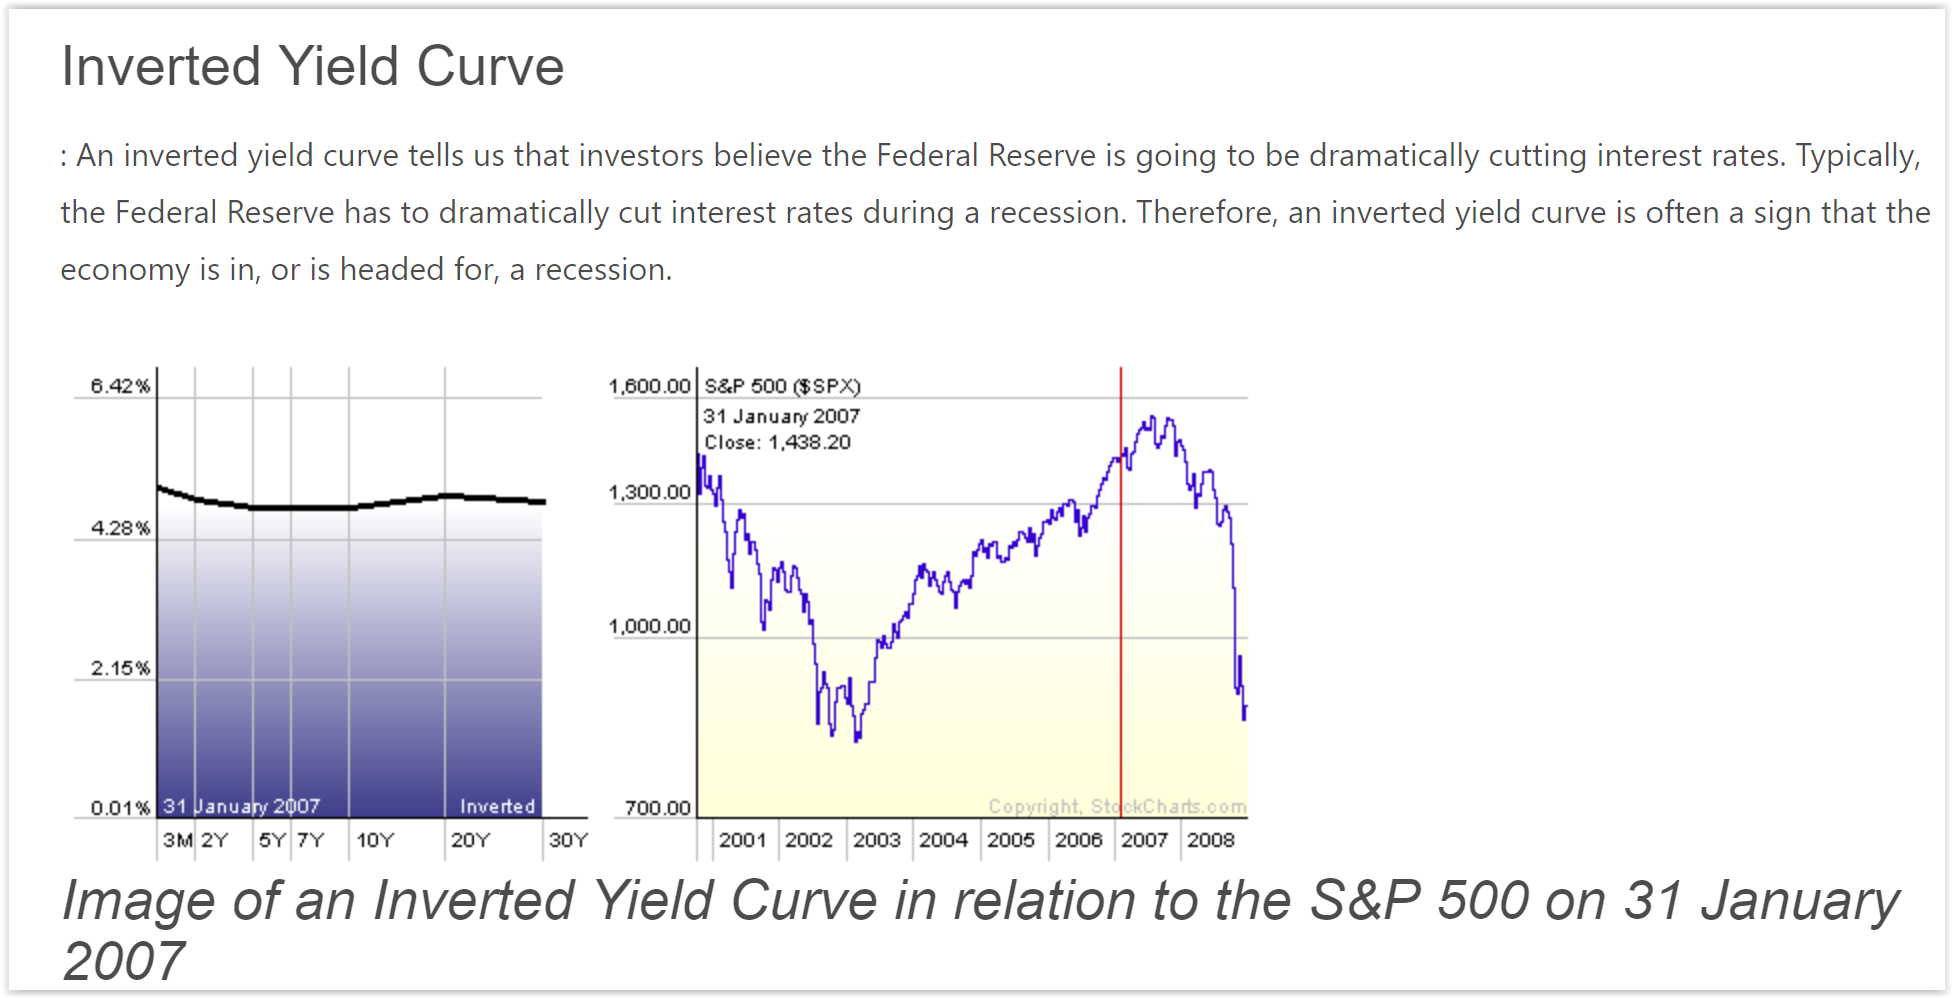
We’ve been in recessions over the last 8 years except for the fact that government spending, fiscal stimulus and GDP recalculations and inputs changed have avoided the “typical” GDP recessions
A comment: “So fudging the numbers… all government’s want to do this”
Deficit for the fiscal 2018 – 1.3 trillion
Hopefully going to spur 1% of GDP growth = 200 billion more taxable dollars
Taxes at 20% = revenue for the gov’t?= 40 billion
Rising interest rates does 2 things =
23 trillion 1% interest rate in bonds = 230 billion in interest payments alone
Slows it down and slows down the money flows
Fed is doing what to their budget?
Contracting, shrinking the money supply
SO, if India wants to grow at 5% GDP they need 5% more US dollars to do so!!!
BECAUSE the world reserve currency, all commodities are traded in US $
The FED has crushed global growth to balance its ridiculous balance sheet right now
Other government to prop up financial markets they have gone to buying the equities outright
Recessions are nothing more that a Fed induced Credit Cycle directly related to money flows
Who is always 100% of the time the last person to the stock market growth party? RETAIL INVESTOR
Always the mean reverts back to parity
In my research over the last 7 months EVERY indicators points to recession/market top/ end of cycle


I don’t see, know or understand how companies are going to be able to even come close to next year’s comp’s because 1/3 of their current growth is NOT organic growth but tax savings and companies are NOT building for the future but they are buying back stock
IT has been a hard year in finding low valuation, high probability growth in stocks to put new money into
The NEXT correction will be exasperated by the algo, robo, computer/stops programs currently running the liquidity in our markets
What happening this week and why?
lower
Where will our markets end this week?
Lower
DJIA – Bullish 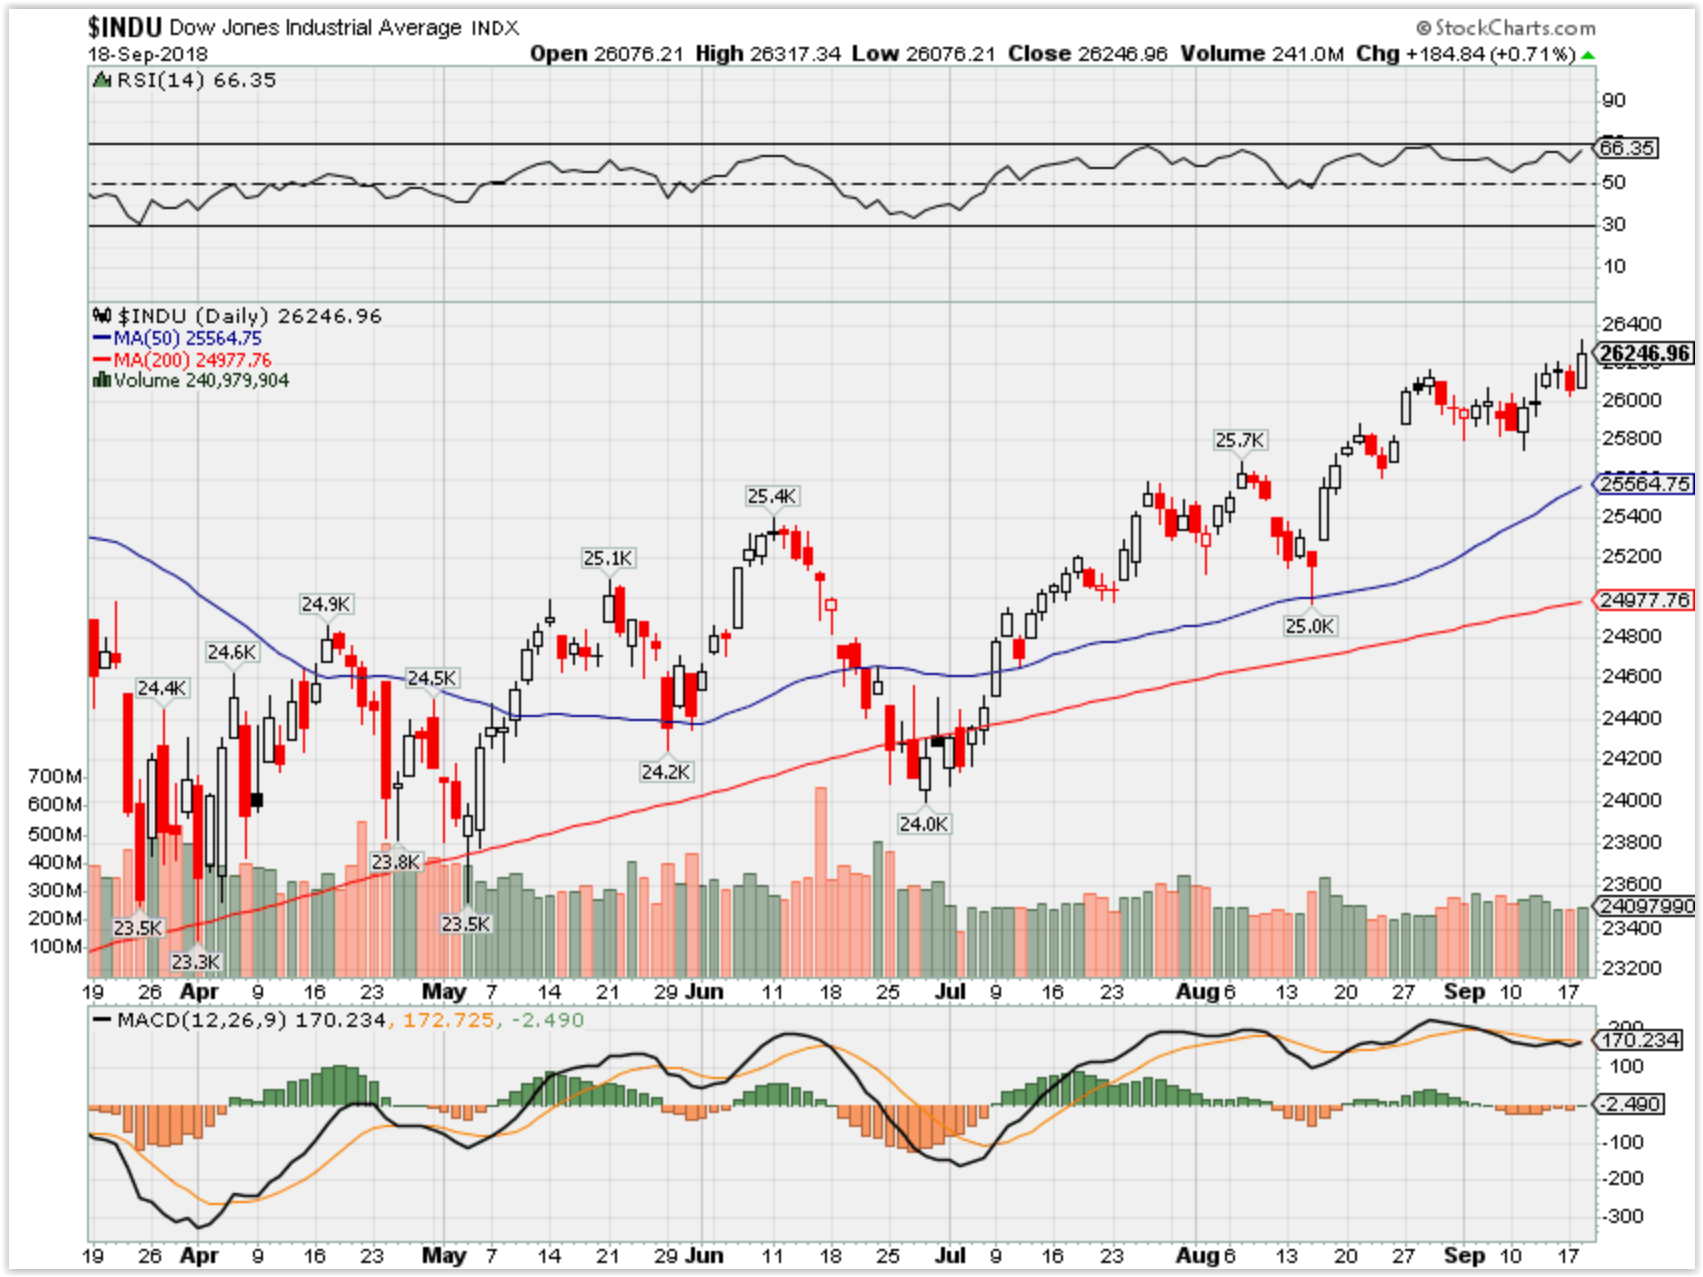
SPX – bullish 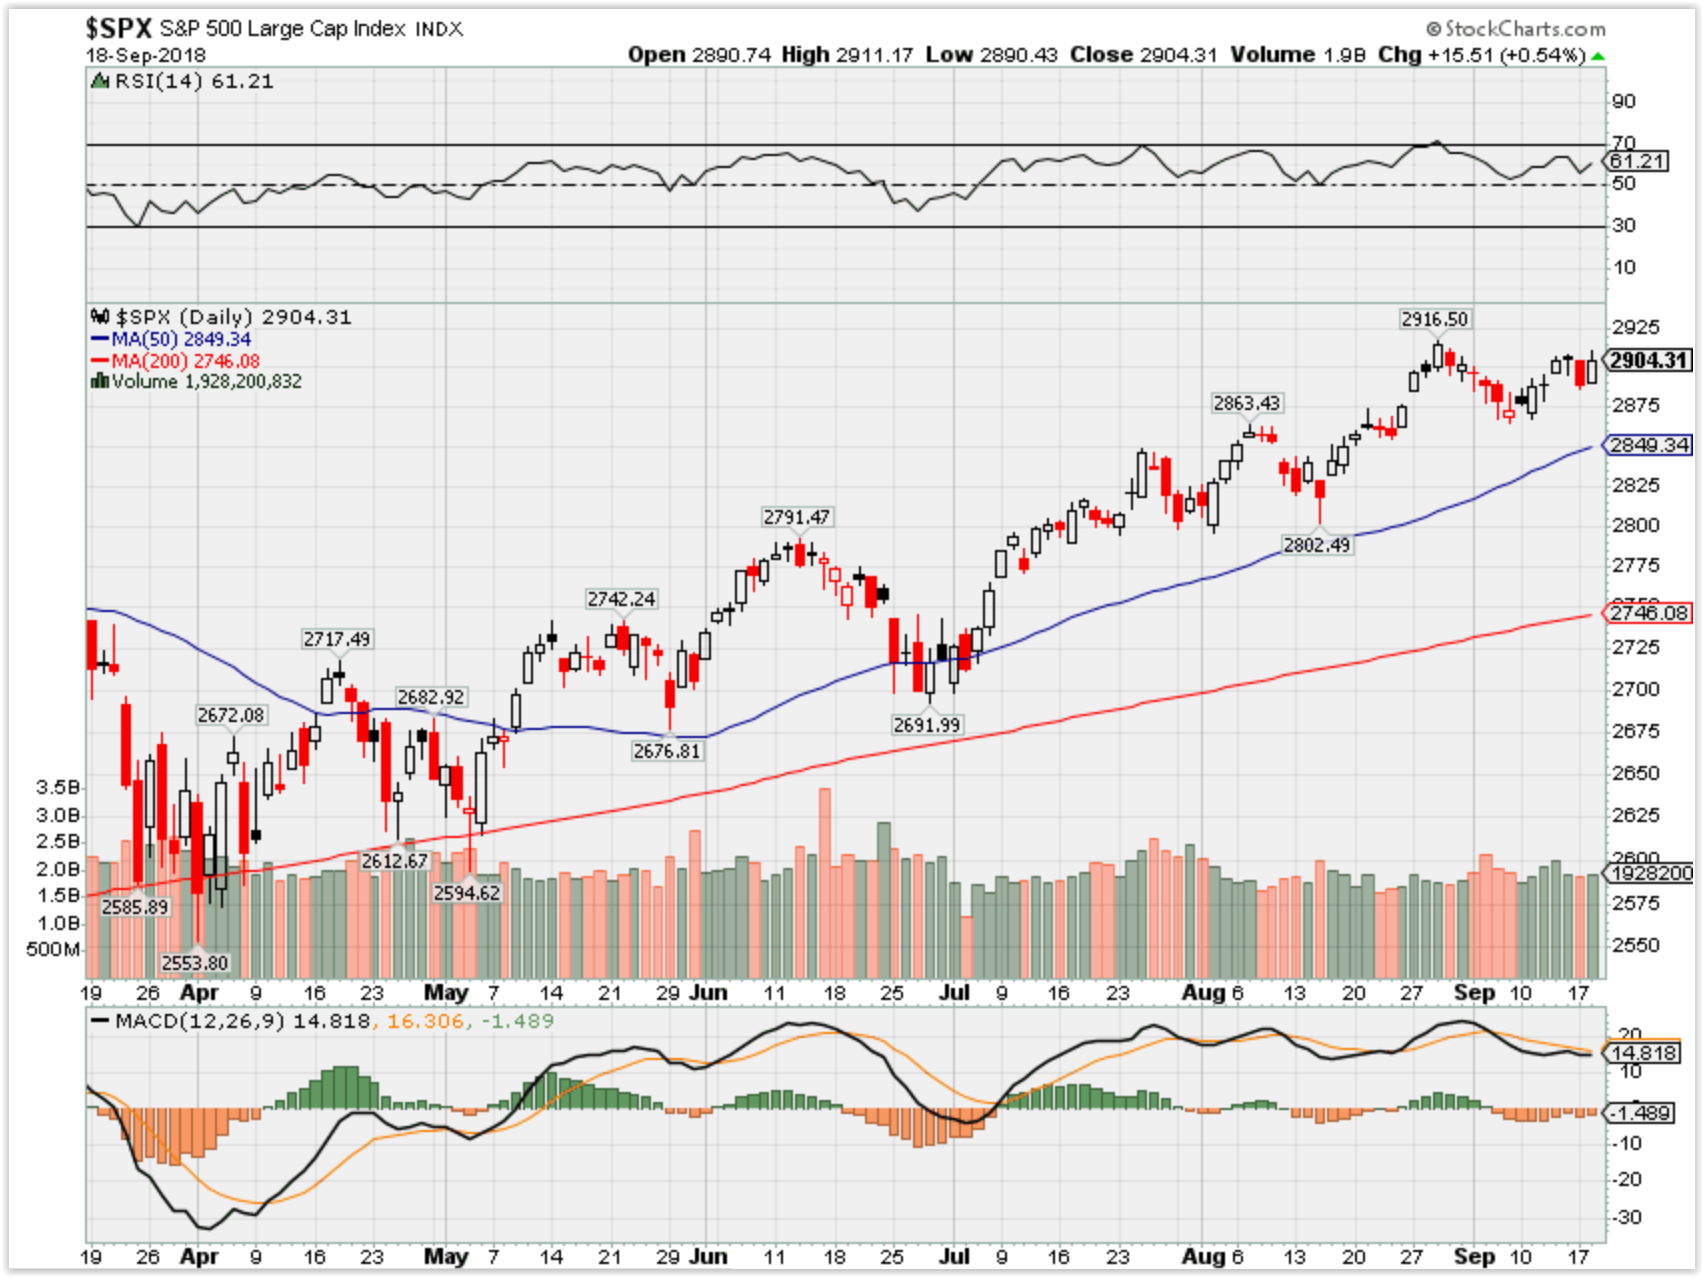
COMP – Bullish 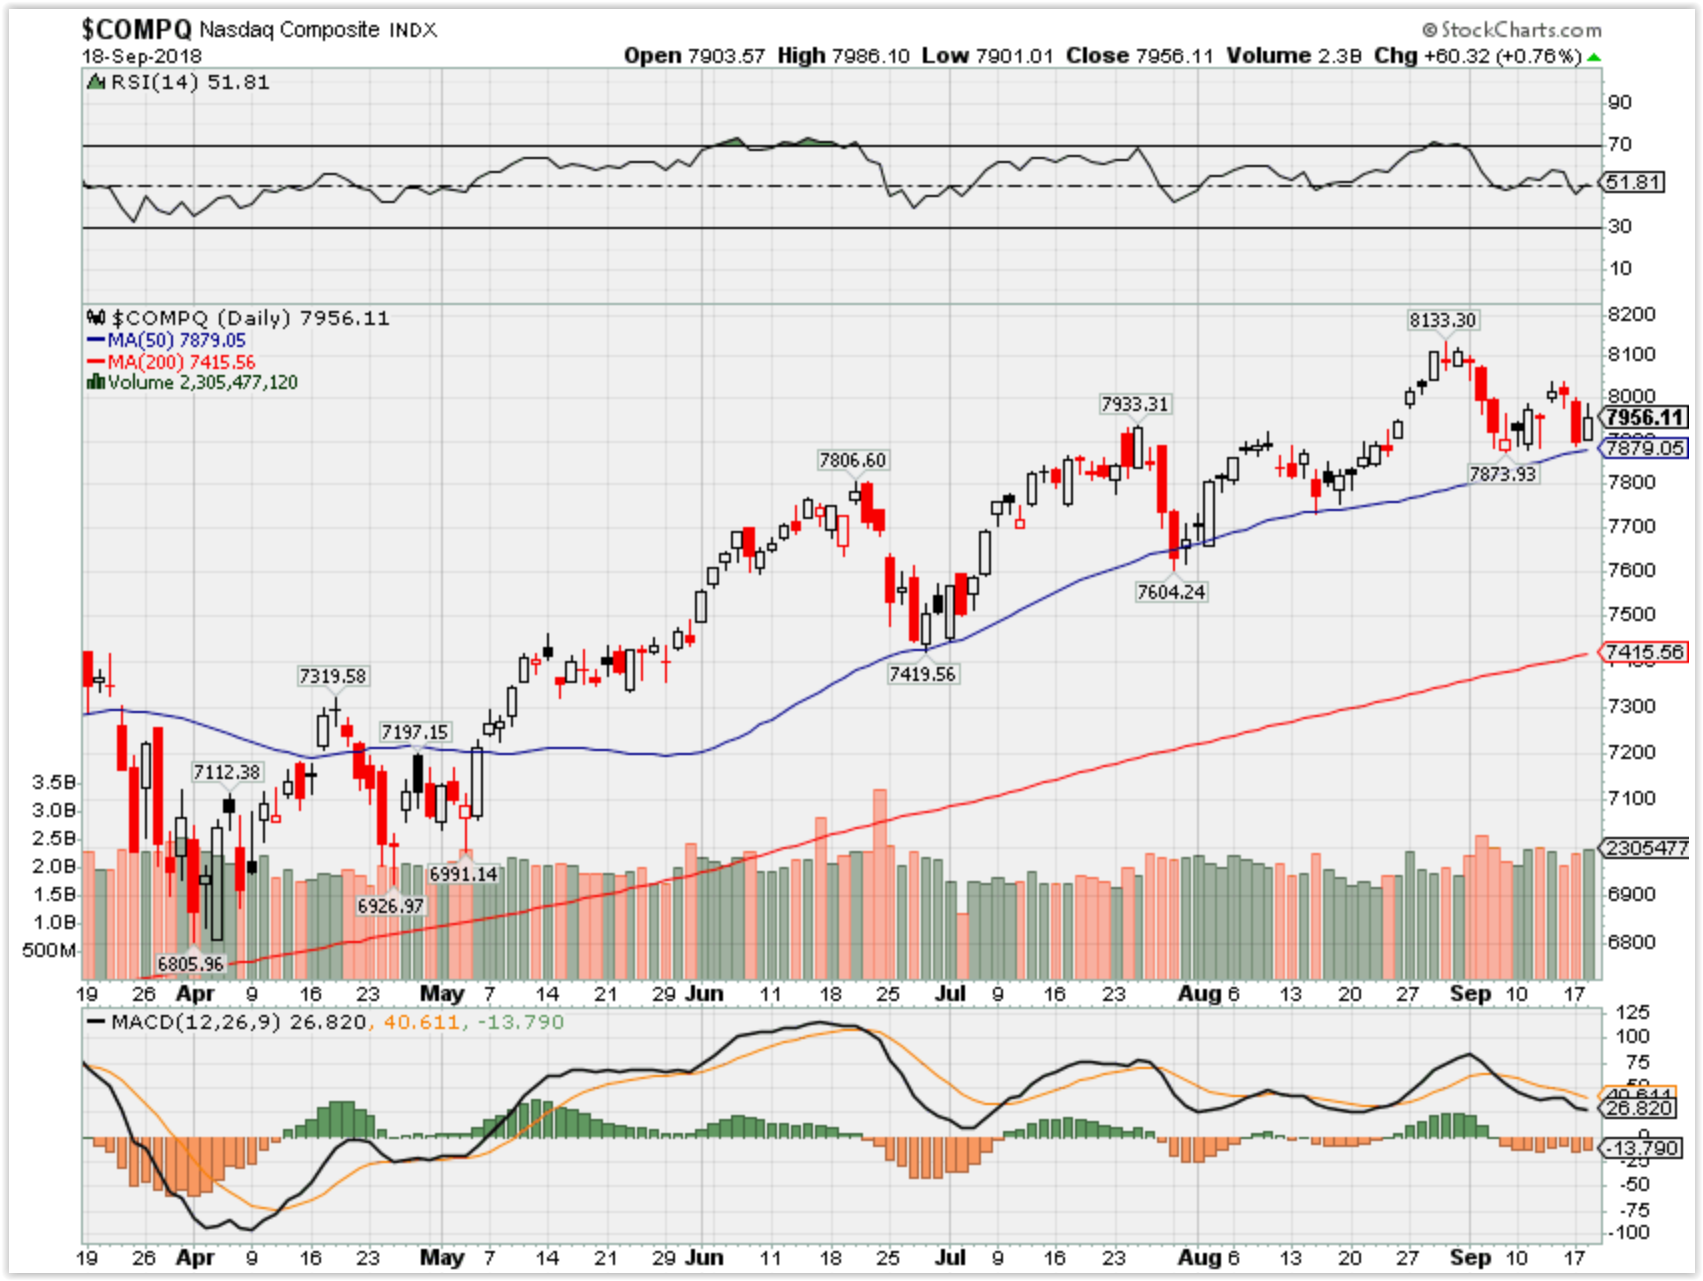
Where Will the SPX end September 2018?
09-18-2018 -2.0%
09-11-2018 -2.0%
09-04-2018 -2.0%
Earnings:
Tues: AZO, GIS
Wed: RHT
Thur: DRI, MU
Fri:
Econ Reports:
Tues: NAHB Housing Market Index, Net Long Term TIC Flows
Wed: MBA, Building Permits, Housing Starts, Current Account Balance,
Thur: Initial, Continuing, Phil Fed, Existing Home Sales, Leading Indicators,
Fri: OPTIONS EXPIRATION
Int’l:
Tues –
Wed –
Thursday –
Friday-
Sunday –
How am I looking to trade?
Added Long puts or bear puts out to OCT monthly for BIDU
Added a small number of FB long call contracts at Jun 2020 $200 Strike
Added Long puts to DIS, F, V shares, BAC,
www.myhurleyinvestment.com = Blogsite
customerservice@hurleyinvestments.com = Email
Questions???
OCT – China Gold back oil trading currency to avoid US $, Rate hike if it doesn’t come in Sept, Start of the UGLY name calling midterm election
Nov 6th we find out if the government hits gridlock
US-China trade war could cause a bear market, stress test shows
- Trade tensions continue between the U.S. and China, but financial markets so far have been largely immune.
- An acid test looms this week, with the Trump administration barreling ahead with plans to slap new tariffs on $200 billion worth of Chinese goods.
- According to a FactSet analyst, the most negative of the scenarios entails a bear market in stocks for the U.S. and several other countries.
Published 2:17 PM ET Tue, 11 Sept 2018 Updated 3:12 PM ET Sun, 16 Sept 2018
President Donald Trump‘s continued push to level the global playing field when it comes to trade has done little to disturb the relentless bull market in stocks.
But nothing lasts forever, and at some points investors will have to react if the tensions continue to escalate. By all indications, an acid test could come as early as week, with the administration poised to impose a range of new tariffs on $200 billion worth of Chinese goods.
Running a series of different scenarios in the U.S.-China conflict, experts at FactSet have come up with a worst-case trade war scenario, one in which most major economies would take a hit and the U.S., along with a few others, would see a bear market emerge.
“In the case of the escalating trade tensions between the U.S. and China, while financial markets still appear to be discounting the global impact of a trade war, our analysis shows that if/when the market does react, the effects will be widespread,” Ian Hissey, vice president in FactSet’s portfolio analytics group, said in a report last week.
Hissey modeled three scenarios: a base case where the dispute continues along its current path and tensions and tariffs gradually escalate; an optimistic result where the U.S. and China reach broad agreements on the future but the newly imposed tariffs remain, and a “conservative” case that involves “rapidly deteriorating” relations and a more profound impact.
In determining impact, Hissey used the market’s Brexit reaction, following the 2016 vote that allowed the UK to leave the European Union, as a template.
He came up with results that showed stocks globally dropping between 8 percent and 17 percent, with markets in the U.S., Canada and Israel faring worst and Japan being the only overall winner. Hissey did not provide a time frame for how long the market move would take.
Trade war stress test for stocks
| Click to edit | Optimistic | Base case | Conservative |
| All countries | -8.34 | -12.11 | -16.97 |
| 5 Best | |||
| Japan | 4.44 | 6.61 | 7.46 |
| Switzerland | -2.46 | -2.27 | -5.23 |
| Denmark | -3.21 | -2.73 | -6.27 |
| Portugal | -3.49 | -3 | -6.12 |
| Netherlands | -3.68 | -3.29 | -7.04 |
| 5 Worst | |||
| Hong Kong | -9.28 | -15.7 | -21.93 |
| UK | -9.57 | -12.84 | -19.45 |
| U.S. | -10.83 | -16.45 | -21.88 |
| Canada | -10.97 | -15.25 | -21.94 |
| Israel | -13.44 | -19.05 | -27.01 |
Source: FactSet
In the event of the trade war continuing, investors fleeing from stocks would be looking for safe havens like bonds.
That also results in disparate returns, according to the analysis, with Japan again being the big winner but other countries emerging seeing impacts both positive and negative. The results in the bond market are considerably better than in stocks.
Trade war stress test for bonds
| Click to edit | Optimistic | Base case | Conservative |
| All countries | 3.59 | 5.31 | 6.86 |
| 5 Best | |||
| Japan | 10.76 | 16.01 | 21.47 |
| Bulgaria | 9.16 | 14.39 | 17.17 |
| Estonia | 8.83 | 14.33 | 17.13 |
| Ireland | 8.35 | 15.03 | 16.91 |
| Leichtenstein | 7.91 | 12.47 | 14.72 |
| 5 Worst | |||
| Saudi Arabia | -2.67 | -7.81 | -11.06 |
| Oman | -3.26 | -9.96 | -13.6 |
| UAE | -3.89 | -15.57 | -24.76 |
| Peru | -4.36 | -21.57 | -30.58 |
| Malaysia | -4.9 | -6.07 | -7.79 |
Source: FactSet
Broadly speaking, winners and losers are based on how closely they are tied with the U.S. on exchange rates. Those with a close relationship tend to lose, while those not tethered to the dollar are generally winners.
“The economic intuition seems simple,” Hissey wrote. “Tariffs hurt the economies of both trading parties by creating inefficiencies and lowering future economic growth. This would have a negative impact on equity market valuations. In turn, sudden dramatic falls in equity valuations likely create a flight to quality assets.”
The latest round in the tariffs is expected to take place soon, with the U.S. enacting new duties, and possible retaliation from Beijing. The U.S. trade deficit with China expanded by $36.8 billion in July and is now at $222.6 billion year to date, according to the Census Bureau.
Nobel Prize winner Shiller sees ‘bad times in the stock market’ ahead
- Yale economist and Nobel Prize winnerRobert Shiller’s measure of long-term stock valuations is pointing to much weaker returns ahead.
- The Shiller CAPE has been a reliable indicator, seeing downturns on Black Tuesday in 1929, Black Monday in 1987 and the dot-com bubble.
- Shiller’s friend and sparring partner Jeremy Siegel disputes the outlook, saying several dynamics argue for consistent strong performance.
Published 12:43 PM ET Fri, 14 Sept 2018 Updated 1:22 PM ET Fri, 14 Sept 2018
Nobel laureate Robert Shiller thinks investors ought to ignore the recent burst in corporate profits and focus on longer-term valuation, which he says carries foreboding news for the stock market.
At a time when earnings are rising 25 percent a quarter, Shilller said that’s not indicative of what longer-term results in the market will be. History has shown that in previous times, particularly around World War I, the late 1920s approaching the time of the Depression, and in the high-inflation 1980s, profits could be strong but equityresults not as much.
In the present case, the recent surge in profits has been due to last year’s tax cuts, backed by President Donald Trump, that took the corporate rate from 35 percent to 21 percent.
“My own way of thinking is it looks like an overreaction,” Shiller said Friday at a conference in New York presented by the Wharton School. “We’re launching a trade war. Aren’t people thinking about that? Is that a good thing? I don’t know, but I’m thinking it’s likely to be bad times in the stock market.”
The Yale economist is known for a number of groundbreaking views and theories on the market, but perhaps most for a gauge he uses to measure stock market valuations. The Cyclically Adjusted Price to Earnings ratio — often referred to as the “Shiller CAPE” or “Shiller PE” — looks at valuations over a 10-year period to smooth for fluctuations in the business cycle.
Currently, the gauge is at 33.3, its highest level since June 2001. The index peaked near 45 in mid-2000, just as the dot-com bubble was about to burst. Testing the model over time, it saw the market crashes in 1929 and 1987 as well as the dot-com bubble.
Shiller cautioned that he is not predicting major calamity for the market but rather a much lower level of returns, in the 2.6 percent annual range, than investors have come to expect during the 9-year-old bull market. The longest rally in history has the S&P 500 up more than 335 percent since the March 2009 bottom.
“It’s not like I’m predicting a crash,” he said. “This is a 10-year forward return. This is not going to be great, because we’re just too high at the present value.”
Among other things, he said the current tax climate won’t last and corporate earnings will come back down, just as they have done in the past.
“Is Donald Trump permanent?” he asked to laughter. “I won’t get into that, a lot of discord about that.”
To be sure, the Shiller CAPE has been elevated for years and crossed 30 nearly a year ago. And not everyone agrees with his analysis — including his friend and sparring partner of 51 years and fellow speaker at the Friday event, Jeremy Siegel.
Siegel is the Russell E. Palmer professor of finance at the Wharton School and has long served as the bull to Shiller’s bear. He contested several of Shiller’s points, particularly about whether the market necessarily needs to revert to trend and what he sees as an oversight on the impact of low-cost passive investing on the market. On the latter point, thanks to low-fee ETFs it now costs investors less to have a balanced portfolio so they don’t require returns as high to beat the market.
Even if stocks are expensive, Siegel said, they remain a bargain compared with bonds when considering the risk premium, or the amount of return investors demand compared to risk.
“Stocks are overvalued on a longer-term basis, but bonds are enormously overvalued on a long-term basis,” he said. “Relative valuation of stocks vs. bonds is among the more favorable — not the most favorable but among the more favorable — in history.”
China may use its property markets to defend against Trump’s trade war offensive
- Rising property prices in China can help the country fend off some of the negative aspects of the trade war with the United States, according to CLSA property analyst Nicole Wong.
- More expensive property would encourage buyers to make purchases to beat further anticipated rises, increase construction jobs and boost local government coffers, she says.
- China has been seeking ways to blunt the negative effects of U.S. tariffs as the trade conflict drags on.
Published 10:37 PM ET Wed, 12 Sept 2018CNBC.com
China has a potentially useful defense in its ongoing trade war with the United States: its vast property market.
The same sector that has long been a source of anxiety about China’s economic fate could also prove to be its temporary savior in the face of tariff pressure from the U.S., according to Nicole Wong, managing director for property research at CLSA.
Authorities are likely to encourage property prices, which are already rising, to increase further to help boost the economy, Wong told reporters Tuesday at the annual CLSA Investors’ Forum in Hong Kong.
“With this trade war going on, we think that the China property market policy would reverse because with a trade war there is this risk of losses of jobs in the unskilled category,” Wong said.
“And the property sector is a very good sort of replacement.” she added.
U.S. President Donald Trump is targeting tariffs on potentially hundreds of billions of dollars in Chinese goods in a bid to both to rebalance trade between the countries and also pressure Beijing to fundamentally change industrial and commercial policies.
China has responded with tariffs of its own, but it imports far less from the U.S. than it exports to the world’s largest economy, so it has had to evaluate other responses. Those have included potentially stimulating the Chinese economy by letting its currency, the yuan, move lower against the dollar and encourage banks to lend more money.
‘Leeway to leverage up’
Wong said that rising property prices can help stimulate the economy in several ways, such as by encouraging buyers to accelerate purchases before the cost goes up, thus bringing forward future demand.
Another positive result of costlier housing, she said, is that savings will move out of banks and into the real economy.
A booming property sector would also increase new jobs centered on the construction industry, and developers’ increased demand for land would mean local governments can rake in more revenues from land sales to invest in infrastructure.
“So the new economy of China is great, but then it really is the old economy that’s going to be a very predictable macro tool for China in times of urgency,” she said, referring to the distinction between headline-grabbing tech firms like Alibaba and long-standing sectors such as construction.
Land and housing have seen immense changes in the 40 years since the Communist Party began opening up China’s economy to free market forces.
One of those reforms was allowing citizens to own property. As China’s economy has grown into the world’s second largest, many have seen their homes become a key source of personal wealth.
Wong said that potential buyers are in a good position because prices are currently affordable and there is plenty of room to take on mortgages.
“Overall, the China property market is just not leveraged,” she said, stressing that household cash savings outnumber outstanding mortgages three to one.
“So this is an industry that’s still got a lot of leeway to leverage up, which we believe would happen,” she said.
https://seekingalpha.com/article/4205478-5-reasons-apple-dividend-growth-dream-stock#alt2
5 Reasons Apple Is A Dividend Growth Dream Stock
Sep. 11, 2018 7:09 AM ET
Summary
Over the past 21 years, Apple has been one of the best performing stocksin the world, growing investor wealth 334 fold.
That’s thanks to incredible innovation and product launches that have made it the most profitable consumer technology brand on earth.
Apple has five catalysts that can get it to a $2 trillion market cap and drive market beating double-digit returns over the next decade.
Today, Apple is probably about 5% overvalued, meaning it might be a good time to wait for a better price before putting new money to work.
And of course, there are several risks Apple investors need to keep in mind.
Apple (AAPL) has managed to become one of the best performing stocks of the last two decades. That’s thanks to becoming one of the most innovative and transformative companies in the world.
AAPL Total Return Price data by YCharts
As a result of introducing products like the iPod, iPhone, and iPad, Apple has managed to achieve sensational long-term total returns and become the first US company to hit a $1 trillion market cap. However, today many investors worry that the company’s best growth days are behind it, and wonder how the company can continue to deliver market beating total returns from here.
Let’s take a look at the five catalysts that will fuel Apple’s continued growth going forward, including how the company will likely achieve a $2 trillion market cap. Specifically, find out why the company remains a dividend growth dream stock and even from today’s record high share price is likely to continue generating strong market beating returns in the coming decade.
But as importantly, discover why the current valuation might be a bit rich, and so income investors might want to wait for a better price before putting new money to work.
1. iPhone Business Is A Free Cash Flow Minting Machine
Many Apple bears point to the company’s continued reliance on iPhone as a source of risk. And indeed, 56% of sales come from this bread and butter product line. However, it’s important to remember that the iPhone continues to be a major growth driver for the company.
(Source: earnings release)
That’s because last year’s introduction of the super premium iPhone X has helped Apple increase its average selling price or ASP by 19.5% from $606 per phone to $724 (iPhone X continues to be the best selling model). That’s largely due to incredible brand loyalty, created by a 98% consumer satisfaction rate for the X, according to analyst firm 451 Research.
That high satisfaction rate is why 81% of consumers surveyed plan to make their next smartphone purchase an iPhone. And about 70% of iPhone users won’t even consider switching to a competing brand. This is why Apple saw double-digit iPhone sales growth in: the U.S., Canada, Germany, Switzerland, Mexico, Hong Kong, Russia, the Middle East and Africa.
When combined with tax reform and the continued torrid growth in its iOS ecosystem segments (accessories and services), this helped drive Apple’s fourth straight quarter of double-digit revenue growth. In fact, fiscal Q2 2018 saw the strongest sales growth in 11 quarters.
| Metric | Fiscal Q3 2018 Results | First 9 Months Of Fiscal 2018 Results |
| Revenue | 17.3% | 14.7% |
| Net Income | 32.1% | 20.6% |
| Free Cash Flow | 86.9% | 21.5% |
| Shares Outstanding | -5.9% | -4.2% |
| EPS | 40.1% | 25.9% |
| FCF/share | 98.6% | 26.8% |
| Dividend | 15.9% | 12.4% |
(Sources: earnings release, Morningstar)
But more important than strong sales growth is growth in the bottom line. That includes very impressive increases in EPS, but most of all free cash flow growth. Free cash flow is what ultimately funds buybacks and dividends.
In the first nine months of fiscal 2018, Apple’s FCF/share soared 27%, thanks in part of the company buying back 4.2% of its shares. But even excluding buybacks, Apple’s FCF/share still grew 22.6%, and over the past 12 months, Apple has generated $56.6 billion in FCF, the highest amount of any publicly traded company in the world. And management believes the strong growth rate will continue into the final quarter of the year as well.
Guidance for fiscal Q4 2018:
- revenue growth: 16.0%
- operating income growth: 16.9%
Ok, so maybe the introduction of the iPhone X has helped Apple have a great 2018. But what about 2019? What’s going to keep driving higher iPhone ASP, revenue and cash flow in the future?
(Source: Benjamin Geskin)
That would be this year’s new slate of iPhones which once more will offer its loyal customers a chance to upgrade to even larger and more premium phones. According to KGI Securities’ analyst Ming-Chi Kuo (whose predictions have almost always been spot on), Apple is going to introduce three main models for 2019 at its September 12th event:
- 8″ iPhone XS ($799 starting price)
- 1″ iPhone 9 ($699 starting price)
- 5″ iPhone XS Max ($999 starting price)
And of course, larger storage upgrades will be available, pushing up the top end of each line by $150. That means that Apple’s top end phone for next year will likely have a selling price of $1,149. The reason I expect Apple’s ASP for 2019 to increase and thus help drive another year of double-digit iPhone sales growth, is because the 6.5″ XS Max is expected to have the same physical dimensions as the iPhone 8 Plus. In other words, thanks to Apple’s wrap around screen technology, the most premium phone will offer large screen loving customers a great reason to upgrade without worries of a phone that is too large to comfortably use or carry.
And beyond 2019? Well, according to Merrill Lynch analyst Wamsi Mohan, “Our checks also suggest that Apple is working with suppliers on a foldable phone (that potentially could double up as a tablet) for launch in 2020.”
(Source: Macobserver)
While such a phone is far from guaranteed to launch in 2020, when Apple eventually does launch a foldable OLED phone, it’s likely to help drive up the company’s ASPs even higher. That would potentially allow the company two more years of solid iPhone revenue growth.
But strong continued iPhone sales over the next few years are hardly the only growth catalyst Apple has.
2. Epic Buybacks Keeps Bottom Line Growth Strong
Since instituting its capital return program in 2012, Apple has returned $300 billion to investors via buybacks and dividends that have been growing at 11.5% CAGR.
(Source: Apple)
Until tax reform created a much lower tax rate for overseas held cash, Apple was forced to borrow heavily against its cash position to buy back shares at an average rate of 4.4% CAGR over the past five years. But under the new tax law, Apple was able to pay a one-time $38 billion repatriation tax and now has access to all of its cash, which totals nearly a quarter of a trillion dollars. And management has an aggressive plan to bring down its net cash position over time.
According to Luca Maestri, Apple’s CFO, “we are targeting to become approximately net cash neutral over time.” That means that Apple wants to only retain enough cash on its balance sheet to cover the repayment cost of its debt, which will mature over various time frames ranging from two to 30 years. That net zero cash plan is why Apple is repurchasing over $20 billion in shares in just the last quarter. Investors can expect Apple’s accelerated buybacks to continue, which reduced its share count over the past year by nearly 6%. But eventually Apple’s excess cash will become depleted so does that mean that massive buybacks will stop? Not at all. That’s because Apple’s retained FCF (free cash flow minus dividend) over the past 12 months was a staggering $45.1 billion. That means that even after paying its fast rising dividend, once Apple’s net cash position hits zero, the company could continue to buy back shares at a rate of over 4%. That would maintain its recent historical buyback rate on retained FCF alone, and assuming no further growth in free cash flow.
But Apple’s free cash flow is likely to continue growing strongly in coming years as well. That’s thanks to its new aggressive focus on monetizing its massive user base which numbers over 1.3 billion devices (including all its product lines).
3. Monetizing Massive User Base
According to UBS, by the end of fiscal 2018, the global iPhone user base will hit 918 million, and in 2019, that figure is expected to top 1 billion. This is the key to Apple’s plans to diversify via continued strong growth in services and iOS ecosystem accessories.
(Source: earnings releases)
Management has stated that it wants to achieve $50 billion in service revenues by 2020. Credit Suisse thinks the company is on track to actually achieve $53 billion in service revenue that year. Apple appears to be well on track to achieve its target with service revenue accelerating in recent years, including 31% YOY growth in the most recent quarter.
(Source: earnings releases)
That is why Apple’s services has become its second largest division, representing 18% of revenue in fiscal Q3. And if you include the company’s accessory and wearable business, which is growing at 37% annually, the total iPhone related ecosystem sales made up 25% of Apple’s revenue in the last quarter.
More importantly, that service revenue is increasingly being driven by strong growth in paid subscriptions (60% YOY revenue growth). That included over 50% YOY growth in Apple Music and 50% growth in Apple Care revenue. This helped to drive Apple’s service revenue to an annual run rate of $38 billion.
And of course, there’s Apple’s fastest growing segment wearables, which include Apple Watch, AirPods and Beats. These products saw YOY sales growth of over 60%, including around 45% in Apple Watch. In the past 12 months, Apple’s wearables alone have generated over $10 billion in revenue. This highlights the strength of Apple’s sticky ecosystem, in which brand loyal customers continue buying its various products and services in order to maximize the utility of the iPhone.
Ok, so maybe Apple’s service and wearables are killing it for now. But what about in the future? How long can Apple maintain such impressive growth rates in services? Well, according to Morgan Stanley (MS) analyst Katy Huberty, Apple could become one of the most dominant names in streaming entertainment in the coming years.
“We believe a bundling of Apple’s video content with Apple Music and the Texture news and magazine subscription service into a $12.99 per month unlimited Apple Media’ service would make the most sense.”
Apple plans to spend $1 billion on exclusive video content in 2018 alone, and has lined up top names in entertainment such as: Steven Spielberg, Reese Witherspoon, Jennifer Aniston, M. Night Shyamalan, Kevin Costner, Martin Scorsese, and Clint Eastwood. Basically, Apple might end up challenging Netflix (NFLX) and Amazon (AMZN) Prime in the streaming video business. According to Morgan Stanley, such a service could obtain over 50 million new subscribers by 2025 and eventually become a $37 billion business in its own right.
The bottom line is that Apple has proven itself to be a master of not just offering premium hardware that consumers love and are incredibly loyal to. It’s also become extremely skilled at offering ever improving services bundled into its ecosystem that creates rapidly growing and recurring cash flow.
That ability to create ever better services and new products to monetize its core ecosystem stems from management’s skilled capital allocation strategy that few other companies can match.
4. Great Management And Smart Long-Term Capital Allocation Maintains Apple’s Moat
Apple is a massive global company, with an amazingly complex supply chain, as well as corporate offices all over the world. Running that increasingly complex empire efficiently isn’t easy which is why good management is essential to the company’s long-term investment thesis.
Running that management team is CEO and Chairman Tim Cook, who was Steve Job’s right hand man. Cook became COO in 2005 and thus oversaw the company’s day to day operations. He took over the top job in 2011 and has been able to maintain Apple’s industry leading profitability. For example, in smartphones, Apple may command about 16% global market share, but that translates into 86% of industry profits. In fact, in the holiday quarter of 2017, the iPhone X alone captured 35% of industry profits. That single phone outearned 600 global android phone manufacturers.
| Company | Gross Margins | Operating Margins | Net Margins | FCF Margins | Return On Invested Capital |
| Apple | 38.3% | 23.7% | 21.6% | 22.9% | 27.4% |
| Industry Average | 23.2% | 4.8% | 3.6% | NA | 16.6% |
(Sources: Gurufocus, Morningstar, CSImarketing)
And thanks to its immense premium branding power (Apple is the most valuable brand in the world for the 8th straight year), Apple continues to enjoy profitability far above its peers. For instance, its net margins are about five times that of most consumer hardware makers. More importantly, its free cash flow margin is 23% which is what allows it to return cash to shareholders by the tens of billions each quarter.
But most important is the company’s strong return on invested capital or ROIC. This is a proxy for good management that allocates investors’ capital wisely. There are two key capital allocations investors need to focus on in the tech industry. The first is acquisitions. Tech companies are famous for large and splashy M&A deals that often result in massive investor losses. But Apple has remained incredibly disciplined with Apple’s approach to M&A.
For example, under Cook, Apple has made 62 small bolt-on acquisitions. The largest of those was Beats which Apple paid $3 billion for. But most acquisitions are under $500 million and are focused on acquiring technology and intellectual property that can increase the premium nature of either its hardware or iOS ecosystem.
The other important thing for investors to focus on is smart R&D spending, which is the lifeblood of the highly competitive tech industry.
AAPL R&D to Revenue (TTM) data by YCharts
Since Cook took the reins at Apple, the company has been steadily boosting its percentage of revenue devoted to R&D. And given the company’s strong growth over the years, that translates into one of the largest R&D budgets on earth.
AAPL Research and Development Expense (TTM) data by YCharts
Now many Apple critics will scoff at this much larger R&D budget and ask what new game changing products are coming from these investments. However, a 2017 report from Boston Consulting Group found that between 2014 and 2017, Apple’s returns on R&D capital were the best of any company in America.
The bottom line is that when it comes to skilled management and good capital allocation, Apple is the industry leader. Tim Cook doesn’t set shareholder cash on fire by making stupid empire building acquisitions, but rather disciplined bolt-on purchases. And the company’s soaring R&D spending is laser focused on improving the core functionality of its sticky ecosystem, to allow management to monetize its massive user base at a remarkably fast pace.
All of which bodes well for Apple’s ability to eventually become a $2 trillion company and continue delivering double-digit dividend growth and total returns for many years to come.
5. Dividend Profile: Double-Digit Earnings And Dividend Growth For The Foreseeable Future
In terms of becoming a $2 trillion company, I expect that Apple’s long-term organic EPS growth potential of about 7% means that by 2028 the market cap will easily hit $2 trillion. That’s assuming no multiple expansion from Apple’s increasing focus on faster growing services which generally command greater multiples than consumer tech hardware. But the total returns Apple investors are likely to enjoy will probably be far greater. That’s thanks to the company’s highly favorable dividend profile.
The dividend profile consists of three parts: yield, dividend safety, and long-term growth potential. Combined with valuation, this ultimately drives long-term total returns.
| Company | Yield | TTM FCF Payout Ratio | 10-Year Analyst Projected Earnings Growth | 10-Year Potential Annual Total Return | Valuation Adjusted Annual Total Return Potential |
| Apple | 1.3% | 23% | 10% to 11% | 11.3% to 12.3% | 10.8% to 11.8% |
| S&P 500 | 1.8% | 38% | 6.2% | 8.0% | 0% to 5% |
(Sources: earnings releases, Morningstar, Gurufocus, FastGraphs, Yardeni Research, Multpl.com, Gordon Dividend Growth Model, Dividend Yield Theory, Simply Safe Dividends, BlackRock, Vanguard)
Apple’s current yield is rather paltry, even by the low standards of the S&P 500. However, what the dividend lacks in size, it more than makes up for in safety and strong growth potential.
Over the past 12 months, Apple has only spent 23% of its fast growing FCF on its dividend. That means two things. First, the payout ratio has plenty of room to expand, meaning the dividend can safely grow faster than FCF/share for many years. Second, there is an enormous safety buffer protecting the current dividend. And when we factor in the company’s bank vault safe balance sheet, we see that Apple’s dividend is among the safest on Wall Street.
| Company | Debt/EBITDA | Interest Coverage Ratio | S&P Credit Rating | Average Interest Rate |
| Apple | 1.4 | 26.8 | AA+ | 2.6% |
| Industry Average | 2.1 | 51.6 | NA | NA |
(Sources: Morningstar, earnings release, Gurufocus, FastGraphs)
Apple’s debt load of $115 billion is among the largest in the world. However, the actual leverage ratio is well below most of its rivals. And its operating cash flow covers its annual interest costs more than 26 times over. And of course, we can’t forget that Apple’s $129 billion net cash position and $45 billion in annual retained FCF means that Apple will likely never borrow again. Rather it will just let its existing debt mature, and pay it off with cash it’s set aside for that purpose. As a result, Apple’s debt will likely eventually fall to zero and it will retain one of the best investment grade credit ratings in corporate America.
What about Apple’s long-term dividend growth potential? Well, due to the very low payout ratio, I expect the company might continue to grow the dividend faster than FCF/share for many years. For example, in 2018, Apple hiked its dividend 16%, the fastest growth rate since it restarted the dividend in 2012.
However, even if the company decides to fix its payout ratio at current levels, analysts are expecting about 10.6% long-term EPS and FCF/share growth. Given that Apple will be repurchasing 4% to 6% of its shares in the coming years, I consider that a very reasonable growth estimate.
As a result, Apple should be capable of double-digit dividend growth for the foreseeable future. That should be enough to generate about 11.9% annualized total returns over time (1.3% yield + 10.6% EPS growth). And adjusting for Apple’s current valuation (more on this in a second), I estimate a likely annualized total return of about 11.4%. That may not sound like much, especially compared to the 42% return investors have seen over the past year. But keep in mind that the S&P 500’s historical return (since 1871) has been9.2%. And from today’s elevated valuations, BlackRock, Vanguard, and Morningstar expect the S&P 500 to deliver anywhere from 0% to 5% CAGR total returns over the next five to 10 years.
In other words, Apple should remain a market beating dividend growth stock, both over the next decade, and possibly far beyond. That being said, I can’t necessarily recommend that investors put new money into the company today.
Valuation: Likely Slightly Overvalued So Wait For A Better Price
AAPL Total Return Price data by YCharts
Apple shares have been on fire over the past year, crushing both the impressive returns of the S&P 500 and the red hot Nasdaq. However, that potentially creates the problem of the stock being overvalued today.
Now it should be noted that there are dozens of ways to value a company, and none are 100% objectively correct. And given that Warren Buffett’s Berkshire Hathaway (BRK.B) (NYSE:BRK.A) increased its stake in Apple by 5% in the last quarter, one can still plausibly argue that Apple remains undervalued even at these all-time highs.
For example, a formula devised by Benjamin Graham, Buffett’s mentor and the father of modern value investing, indeed shows the company as trading far beneath its intrinsic value. According to Graham, the fair value PE of a stock is: (8.5 + (2X long-term EPS growth rate))/discount rate. The discount rate is your targeted return and for the calculation you need to use the decimal form.
While discount rates are different for everyone, I use 10% for the following example. That’s because 10% is above the market’s historical total return and most investors would be very happy earning long-term double-digit profits.
| Forward PE Ratio | Implied Growth Rate | 20-Year Average PE Ratio | Fair Value PE | Discount To Fair Value |
| 16.5 | 4.0% | 25.6 | 27.0 | 38% |
(Sources: Gurufocus, Benjamin Graham, FastGraphs)
Apple’s current forward PE is 16.5 which is far below its 20-year average PE of 25.6. Of course, those 20 years include periods of hyper growth fueled by game changing product launches that are not likely to be repeated.
However, according to the Graham Fair Value PE formula, Apple shares are currently only baking in 4% long-term EPS growth. Buybacks alone are likely to drive stronger earnings growth, even if the company’s sales and profits were to remain flat. According to the Graham formula, if Apple is able to achieve 10.6% EPS growth over the next decade (which I consider likely), then a fair value PE is 27. That implies shares might be as much as 38% undervalued. This might explain why Buffett continues adding to his company’s position each quarter despite a rising share price.
However, personally I’m less enthusiastic about recommending income growth investors buy Apple today. That’s because two other valuation methods I favor indicate shares might me highly overvalued.
The first, and by far my favorite, is the dividend yield theory, which has proven highly effective since 1966. Dividend yield theory says that over time, a quality dividend stocks’ yield will mean revert, or return to a relatively fixed point that approximates fair value. Buy above the historical yield, and you’re likely purchasing undervalued shares and will thus see a valuation boost to your long-term total returns.
| Yield | 5-Year Average Yield | 6-Year Median Yield | Discount To Fair Value |
| 1.3% | 1.8% | 1.7% | -26% |
(Sources: Simply Safe Dividends, Gurufocus, Dividend Yield Theory)
Apple’s dividend is relatively new, being introduced in 2012. But since that time its five-year average yield has been 1.8% and its six-year median yield has been 1.7%.
Under dividend yield theory, Apple’s fair value yield is about 1.75%, meaning that today’s shares might be 26% overvalued. That’s certainly a major difference from the Graham Fair Value estimate. So for confirmation, I turn to what’s usually a great conservative valuation model, Morningstar’s three-stage discounted cash flow analysis.
Because Morningstar analysts are 100% long-term focused on pure fundamentals. They also tend to use more conservative growth assumptions than most analysts or even management itself. Thus, the Morningstar fair value estimate is a good low ball figure for a company’s intrinsic value.
| Morningstar Fair Value | Discount To Fair Value |
| $175 | -26% |
(Source: Morningstar)
For instance, Morningstar analyst Abhinav Davuluri expects 2019 iPhone volumes to decline, long-term sales growth to stabilize at 4% to 7%, and operating margins to fall by 2% through 2022. With these conservative assumptions, Morningstar estimates Apple is worth $175 today, or 26% overvalued. That’s exactly what dividend yield theory says as well.
Since a good case can be made for all three models, for my official fair value estimate, I take the average of these three models.
| Estimated Fair Value | Discount To Fair Value | Long-Term CAGR Valuation Return Boost |
| $210 | -5% | -0.5% |
(Sources: Simply Safe Dividends, Gurufocus, Dividend Yield Theory, Morningstar, Benjamin Graham)
Thus, I estimate that Apple’s fair value is about $210. That means the stock is potentially about 5% overvalued. That means that the current valuation would drag on Apple’s total returns by 0.5% annually. This is how I come to my valuation adjusted total return expectation of: 1.3% yield + 10.6% EPS growth -.5% valuation drag = 11.4%.
Now 11% long-term total returns are still very good, and likely means that if you buy Apple today you’ll do well over time. However, I personally only recommend dividend growth stocks at fair value or below. Thus, I label Apple a “hold” for now and advise waiting for a more attractive price.
Of course, anyone buying or owning Apple should only do so if they are comfortable with its risk profile.
Risks To Consider
While Apple is a low risk stock, there are still important challenges the company faces that investors need to be aware of. The first is that Apple is likely to struggle to increase its market share (15.6%) in global smartphones due to lots of cheaper competition in emerging markets.
And according to analyst firm IDC, global smartphone sales are likely to grow just 2.8% CAGR between 2017 and 2022 (from 1.5 billion to 1.7 billion). This means that beyond new phone design launches in 2019 and 2020, Apple might struggle with flat iPhone revenues. That means that Apple’s future revenue growth is going to depend on monetizing its user base. However, most analysts believe that Apple’s non-iPhone sales growth is only capable of driving about 5% long-term sales growth for the company. Even factoring in strong buybacks, the days of Apple being able to deliver 20+% EPS or FCF/share growth will soon be permanently behind it.
And then there’s the risk of Apple expanding into the streaming media market where it will be competing with massive rivals including:
- Disney’s (DIS) Hulu (60% ownership) and standalone streaming service (launching 2019)
- Amazon Prime
- Netflix
Netflix is planning on spending about $8 billion on content this year and Amazon about $5 billion. These steep costs are expected to rise in coming years and might result in lower operating margins.
AAPL Operating Margin (TTM) data by YCharts
As you can see, Netflix, even with improving economies of scale, enjoys far lower operating margins than Apple. Thus, the risk is that Apple’s overall profitability could take a hit.
And what about wearables? Well, while the Apple Watch currently has about34% market share, that still amounts to just 3.5 million units in Q2 2018, according to analyst firm Canalysis. The entire smartwatch industry shipped about 10 million units in that quarter and industry growth is slowing sharply. In other words, wearables might fail to be a major profit driver for Apple.
And in other accessories, like home speakers, Apple is far behind the curve.
Rivals like Alphabet (GOOG) (NASDAQ:GOOGL) and Amazon dominate with Apple estimated to have sold just 3 million units in the last quarter.
And then there’s the fact that as Apple shifts away from iPhone reliance, its impressive ROIC might fall further.
AAPL Return on Invested Capital (TTM) data by YCharts
The bottom line is that while Apple doesn’t appear to be at risk of losing its loyal customer base to rivals like Android, its long-term growth rate potential is far smaller than it was in the past. As a result, investors can’t expect the stock to deliver anywhere near the kinds of 42% annual total returns they’ve enjoyed over the past year.
Over the long term, I expect Apple to be a solid dividend growth stock, delivering about 10% to 11% EPS and FCF/share growth, and potentially 15% dividend growth. This is why I think Apple’s PE multiple is unlikely to see significant expansion and why I personally think income growth focused investors are probably better off waiting for a better price, or more specifically, a fair value yield closer to about 1.75%.
Bottom Line: Apple Remains A Long-Term Dividend Growth Dream Stock
Apple’s days of triple-digit hypergrowth are almost certainly behind it. But its strong brand, sticky ecosystem, and incredibly profitable core iPhone business will continue to be a massive source of steady free cash flow in the coming years. That alone would mean that its epic capital return program is likely to make it a long-term dividend growth dream stock.
Meanwhile, management’s proven ability to monetize its enormous installed user base means that Apple’s top line is likely to continue growing steadily for the foreseeable future. And despite what many think, the company’s strong dedication to large, but highly disciplined R&D spending means that the company should continue to find new ways of growing its sales, cash flow, and dividend in the next decade.
And while the 42% rally over the past 12 months likely means the stock is now slightly overvalued, I still consider Apple to be a great long-term income growth investment. That’s because even from today’s valuation, the company is likely to deliver about 11.4% long-term annualized total returns which could be more than double the returns the broader market delivers over the next five to 10 years.
Disclosure: I/we have no positions in any stocks mentioned, and no plans to initiate any positions within the next 72 hours.
I wrote this article myself, and it expresses my own opinions. I am not receiving compensation for it (other than from Seeking Alpha). I have no business relationship with any company whose stock is mentioned in this article.
This is billionaire Jeff Bezos’ daily routine and it sets him up for success
9:30 AM ET Sat, 15 Sept 2018
Jeff Bezos is in charge of a lot. He’s the CEO of Amazon — a company that is producing movies, developing A.I. voice technology and operating a grocery store in addition to remaking the e-commerce landscape — and he’s the founder of Blue Origin and the owner of The Washington Post.
Surprisingly, his days aren’t rushed. Instead, Bezos takes time to rest, recharge and make decisions carefully, he told the audience at the Economic Club of Washington, D.C. on September 13. Here’s what a typical day for Bezos looks like.
He wakes up early
“I go to bed early, I get up early,” Bezos said at the event.
Other CEOs are known to wake up before the sun: Apple CEO Tim Cook is awake at 3:45 a.m., while Ellevest CEO Sallie Krawcheck and Pepsi CEO Indra Nooyi are up by 4.
He “putters” and eats breakfast with his family
Once he’s up, Bezos takes some time for himself: “I like to putter in the mornings,” he said.
“I like to read the newspaper, I like to have coffee, I like to have breakfast with my kids before they go to school,” Bezos explained. “My puttering time is very important to me.”
Bezos has been known to make mighty breakfasts, he once cooked up blueberry-chocolate chip pancakes for husband and wife duo Seattle Seahawks player Russell Wilson and singer/songwriter Ciara.
And, he’s often in charge of doing dishes.
Bezos could be on to something: Taking time to “putter,” cook, or clean up, may be useful for creativity, according to a study by the University of California, Santa Barbara. Spending time on mindless tasks allowed the mind to wander and be more creative, researchers found.
He starts with his most important meetings
When Bezos is ready to turn to business, he devotes all of his focus to Amazon: “I set my first meeting for 10 a.m.,” he explains.
The first meetings of the day are the ones that require the most brain power.
“I like to do my high IQ meetings before lunch, like anything that’s going to be really mentally challenging, that’s a 10:00 a.m. meeting,” he says.
According to a study by biologist Christoph Randler, “People whose performance peaks in the morning are better positioned for career success, because they’re more proactive than people who are at their best in the evening.”
He draws a line when he’s tired
At the end of the day, Bezos tries to avoid making decisions. “By 5:00 p.m., I’m like ‘I can’t think about this today, let’s try that again tomorrow at 10:00 a.m.,'” Bezos says with a laugh.
Making thoughtful choices often becomes harder and harder throughout the day due to decision fatigue.
“Once you’re mentally depleted, you become reluctant to make trade-offs, which involve a particularly advanced and taxing form of decision making,” The New York Times explains of the phenomenon.
He makes sure to get enough sleep
To be as effective at making decisions as possible, Bezos also prioritizes sleep.
“I get eight hours of sleep, unless I’m traveling in different time zones,” he explains. “Sometimes it’s impossible but I am very focused on it. For me, I need eight hours of sleep. I think better, I have more energy, my mood is better, all these things.”
Indeed, it’s part of Bezos’ “work-life” harmony concept.
It’s all about setting himself up for success
“Think about it, as a senior executive, what do you really get paid to do?” Bezos says. “As a senior executive, you get paid to make a small number of high quality decisions. Your job is not to make thousands of decisions every day.”
The way he sees it, if you don’t take care of yourself, “[the] quality of those decisions might be lower because you’re tired or grouchy or any number of things.”
HI Financial Services Mid-Week 06-24-2014