
HI Market View Commentary 01-15-2019
What I want to talk about today?
Let’s talk goals this week and next week
David – Make more money
Mod – Have a positive return
What’s missing – How to get there
Most have closed out losing trades and are now starting with less money
Remain disciplined to your system then the system doesn’t work !!!!!
MY Collar trade system
$100 Stock how much money is at risk?=$100
So if you have 500 share * $100 = $50,000 at risk
We buy the $100 strike long put for usually 7% or $7 for 12 weeks
New Cost basis = $100 + $7 = $107
New risk in the trade ? Right to sell @ $100 – 107 = -$7
Did a lot of stocks fall 40% last year?
AAPL, BIDU, BAC, FB, F
Did some fall 20%?
DIS, V
We still have lots of cash collected from the insurance to buy more shares
500 share and add another 100 @ $80 a share
58K / 600 = 96.66 per share cost basis
With another 100 shares it will be 60K, more dividends, and if it get to 120 = 72K not 60K
Where will our markets end this week?
Higher
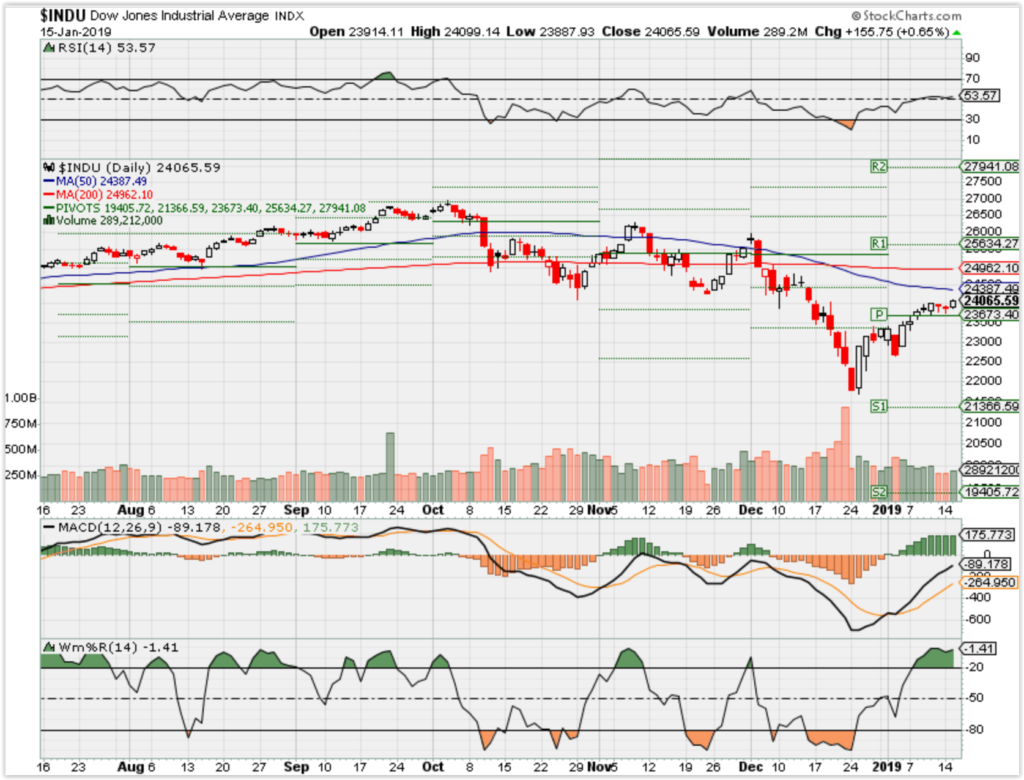
DJIA – Bullish
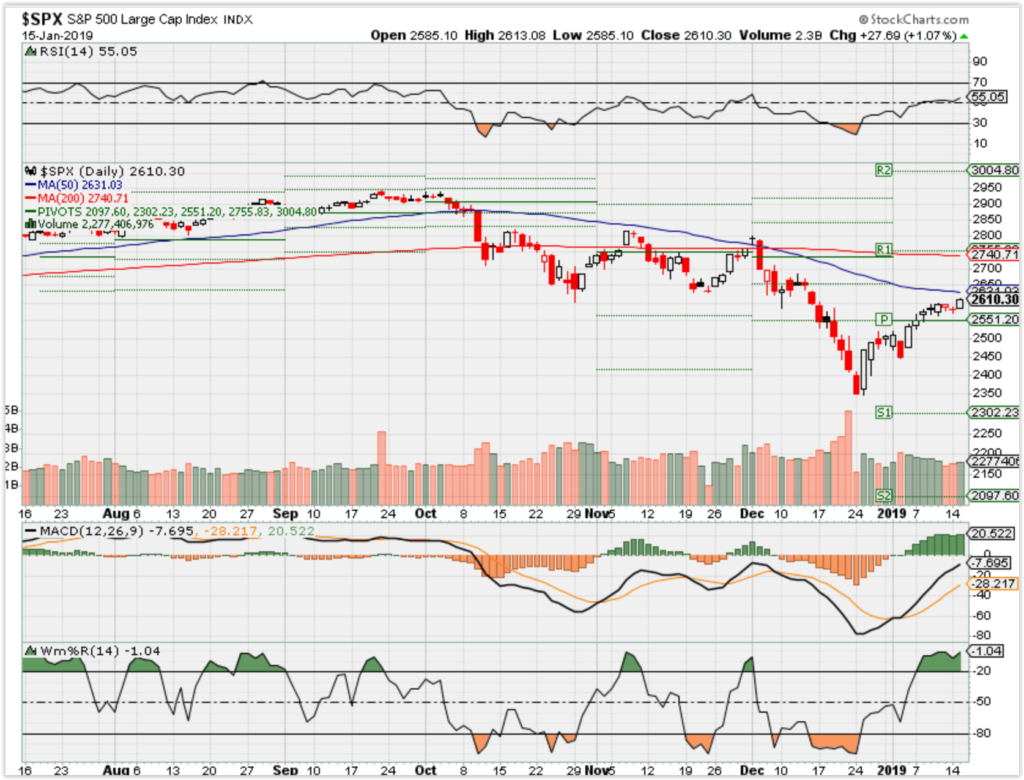
SPX – Bullsih
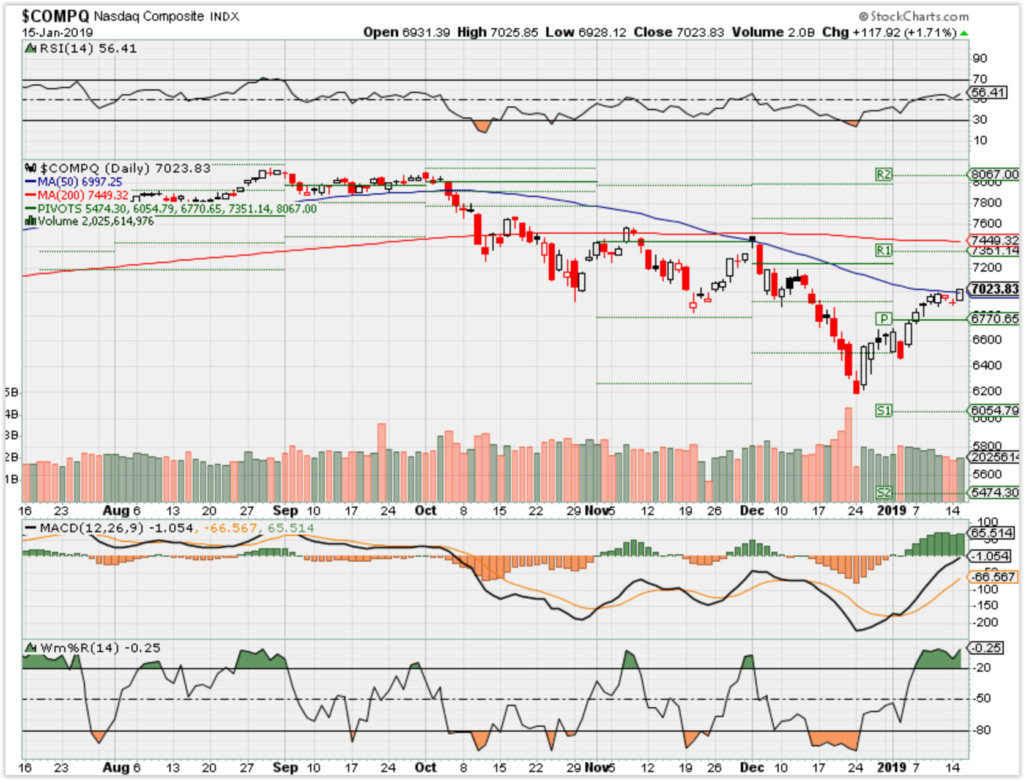
COMP – Bullish
Where Will the SPX end January 2019?
01-15-2018 +1.0%
01-08-2019 +2.0%
Earnings:
Tues: DAL, JPM, UNH, WFC, UAL
Wed: BK, BLK, GS, PNC, USB, BAC, AA, CSX, FUL, KMI
Thur: SCHW, FAST, KEY, MS, AXP, NFLX
Fri: FHN, STI, VFC
Econ Reports:
Tues: PPI, Core PPI, Empire Manufacturing
Wed: MBA, Retail Sales, Retail Ex-trans, Import, Export, NAHB Housing, Fed Beige Book , Net Long term ZTIC Flows,
Thur: Initial, Continuing, Housing Starts, Building Permits, Phil Fed
Fri: Capacity Utilizations, Industrial Production, Michigan Sentiment, Options Expiration,
Int’l:
Tues – BREXIT VOTE
Wed –
Thursday –
Friday-
Sunday –
How am I looking to trade?
Earnings are coming up and protecting through earnings
AA – 1/16 AMC
AAPL – 1/29 AMC
AOBC – 2/28
BAC – 1/16 BMO
BIDU – 2/12 AMC
DIS – 2/05 AMC
F – 1/23 AMC
FB – 1/20 AMC
FCX – 1/24 BMO
GOOGL – 2/4 AMC
IBB
INTC 1/24 AMC
MO – 1/31
MRO – 2/13 AMC
MRVL 3/17
OIH
RHT – 3/26
UAA – 2/12 BMO
V – 1/30 AMC
ZION – 1/22 AMC
www.myhurleyinvestment.com = Blogsite
customerservice@hurleyinvestments.com = Email
Questions???
https://finance.yahoo.com/news/tax-filing-2019-whats-tax-204952670.html
Tax-Filing in 2019: What’s My Tax Bracket?
Susannah Snider
U.S.News & World ReportJanuary 11, 2019Determining which tax bracket your income falls into is surprisingly complex. But performing this calculation can be instrumental in helping you find strategies to reduce your federal tax bill and double-check any calculations done by a tax-software program or tax preparer.
Taxpayers in 2019 should know that the Tax Cuts and Jobs Act generally reduced tax rates. But they should also note that the increased standard deduction and loss of personal exemptions, among other factors, will impact the calculations used to determine the tax bracket into which their income falls.
[See: 15 Tax Questions — Answered.]
In general, there are seven tax brackets for ordinary income — 10 percent, 12 percent, 22 percent, 24 percent, 32 percent, 35 percent and 37 percent — with the bracket determined by filers’ taxable income. The federal government uses a progressive tax system, which means that filers with higher incomes pay higher tax rates. It’s also graduated in such a way so that taxpayers don’t pay the same rate on every dollar earned, but instead pay higher rates on each dollar that exceeds a certain threshold.
To determine your tax bracket and its impact on your tax liability, follow these steps:
— Identify your filing status.
— Tally your income.
— Explore the income tax brackets for 2019.
— Understand the marginal rate vs. effective rate.
— Consider ways to lower your tax rate.
Read on for additional information about each of these tax-filing processes — and how to use them to reduce your bill or increase your tax refund this year.
[Read: Should I Take the Standard Deduction?]
Identify Your Filing Status
Before you know which tax bracket your income falls into, you have to know your tax-filing status. Common statuses include:
— Single
— Married filing jointly
— Married filing separately
— Head of household
The status you’ll use will depend on whether you’re single or married, have qualifying dependents and other aspects of your specific tax situation. Many married couples file taxes jointly, but some may choose to file separately to reduce their student loan payments or because they’re in the process of divorcing.
Tally Your Income
Full disclosure: This step is difficult to do by hand, but it can be a worthwhile exercise.
First, calculate earnings from your work, investments, alimony, rental properties and other sources, then subtract any income that is considered an exclusion by the tax code, such as proceeds from a life insurance policy. That calculation will yield your gross income.
“Gross income is pretty much everything, and it’s defined in the law as income from all sources unless there’s an exception in the tax code,” says Chris Raulston, a Memphis, Tennessee-based wealth strategist at Raymond James.
Next, you’ll subtract certain tax adjustments, such as student loan interest and contributions to an individual retirement account, or IRA, to figure out your adjusted gross income.
[See: 10 Smart Ways to Spend Your Tax Refund.]
Feeling tired? You’re not done yet.
After determining adjusted gross income, you’ll need to subtract tax deductions. That involves deciding whether to take the standard deduction ($12,000 for single filers; $24,000 for married filing jointly) or itemize, which you do by manually subtracting below-the-line deductions, such as charitable contributions and mortgage interest.
Finally, you’ll have reached your taxable income and can start to determine your tax bracket using this number. To complicate things, certain investment income is taxed at a capital gains rate and not at the ordinary income rate. So, keep that in mind as you do this exercise.
Explore the Income Tax Brackets for 2019 Tax Season
Below are the tax brackets for the 2019 filing season for three common filing statuses. Dollar amounts represent taxable income earned in 2018:
| Rate | Single | Married Filing Jointly | Head of Household |
| 10% | $0 – $9,525 | $0 – $19,050 | $0 – $13,600 |
| 12% | $9,525 – $38,700 | $19,050 – $77,400 | $13,600 – $51,800 |
| 22% | $38,700 – $82,500 | $77,400 – $165,000 | $51,800 – $82,500 |
| 24% | $82,500 – $157,500 | $165,000 – $315,000 | $82,500 – $157,500 |
| 32% | $157,500 – $200,000 | $315,000 – $400,000 | $157,500 – $200,000 |
| 35% | $200,000 – $500,000 | $400,000 – $600,000 | $200,000 – $500,000 |
| 37% | More than $500,000 | More than $600,000 | More than $500,000 |
Find the range into which your taxable income falls (remember, that’s after taking out adjustments and deductions) to determine your 2019 tax bracket and corresponding rate.
Understand the Marginal Rate vs. Effective Rate
Say you’re a single filer who earned $50,000 in 2018 in taxable income. You’ll use the table to determine that you fall into the 22 percent tax bracket, which is known as your “marginal rate.” But that doesn’t mean you pay 22 percent of every taxable dollar to Uncle Sam. “Just because your income may fall into the 22 percent or 24 percent tax bracket, it doesn’t mean all your income is taxed at 22 percent or 24 percent,” says Mark Jaeger, the Cedar Rapids, Iowa-based director of tax development at tax software company TaxAct.
Instead, you’re paying 22 percent on any amount you earn above $38,700. So, your effective tax rate will actually look like this:
10 percent x $9,525 = $952.50 12 percent x $29,175 ($38,700 –
$9,525) = $3,501
22 percent x $11,300 ($50,000 – $38,700) = $2,486
Your total tax liability will be the total of those amounts, or $6,939.50, which is a nearly 14 percent effective rate.
Consider Ways to Lower Your Tax Rate
To lower their tax bill, filers may want to use strategies to place themselves in a lower tax bracket, especially if their taxable income falls right on the cutoff line between brackets.
Before the end of the tax year is the best time to consider moves such as delaying income or making contributions to certain accounts, such as health savings accounts and retirement funds, experts say. But there is one more move they can make after Jan. 1. “Now that we’re in 2019, making those moves is starting to wind down,” Jaeger says. “But you can still make that traditional IRA deduction through April 15.” So if you’re looking to reduce taxable income for the taxes paid in 2019, make this retirement plan contribution before filing your taxes.
Work with your tax preparer or financial advisor to identify additional ways to lower your tax bracket. A financial professional may suggest “bunching” deductions in 2019, for example, to qualify to make itemized deductions and lower your tax bill.
Bottom line: Knowing your tax bracket will help you better understand your tax bill and how to reduce it.
https://finance.yahoo.com/news/q4-earnings-season-preview-news-priced-in-163705017.html
The market is about to get bad news from corporate America
Markets Reporter
January 13, 2019
Fourth quarter earnings season is upon us.
In the week ahead, earnings from major U.S. banks for the final quarter of the year will begin rolling in with key reports also expected from across industries.
But if the news we’ve already heard from some big U.S. corporates about the final months of 2018 and the road ahead for the global economy are any indication, the weeks ahead are not going to be encouraging.
In late 2018, FedEx (FDX) gave investors the first major indication of troubles about the global economy, with company management saying its international business had “weakened significantly since we last talked with you during our earnings call in September.” Adding that, “China’s economy has weakened due in part to trade disputes.” FedEx cut its outlook for 2019 as a result.
On January 2, Apple (AAPL) shocked markets when it said sales for its holiday quarter would sharply miss expectations. CEO Tim Cook mentioned China 11 times in a letter to investors published, writing in part, “While we anticipated some challenges in key emerging markets, we did not foresee the magnitude of the economic deceleration, particularly in Greater China.”
The following day, the Dow dropped 660 points and the Nasdaq fell 3%.
A trade-in for iPhone XR promotion board is displayed as an Apple employee waits for customer at its retail store in Beijing, Thursday, Jan. 3, 2019. Apple Inc.’s $1,000 iPhone is a tough sell to Chinese consumers who are jittery over an economic slump and a trade war with Washington. (AP Photo/Andy Wong)
More
Last week, the S&P 500 finished higher in four out of five sessions, giving investors perhaps some sense of reprieve after the brutal trading that capped 2018. During the week, however, corporate America offered investors a message less in-line with how the market behaved and more in-line with what Apple said the prior week.
Retailers Macy’s (M) and Kohl’s (KSS) both provided disappointing preliminary looks at the holiday period, as did apparel company L Brands (LB). Target (TGT), however, reported same-store sales that topped expectations for the holiday period. Additionally, two major airlines — Delta (DAL) and American Airlines (AAL) — cut their forecasts.
This batch of bad news, however, mostly concerned the U.S. economy. In the earnings season ahead, Apple’s warning about the Chinese economy seems likely to be the most common source of disappointing results.
This past week, Goldman Sachs analysts downgraded shares of Starbucks (SBUX) citing concerns about the Chinese economy, while Reuters reported that Beijing will cut its target growth rate for 2019.
And this coming week, industrial coatings giants PPG (PPG) is set to report results. And though PPG’s earnings report may often go unnoticed by the broader market, the company back flagged a number of concerns about the global economy back in October that we urged investors to note at the time.
Because although Fed policy and the economic situation in the U.S. is part of the basket of potential worries for investors, nothing hurts markets more than the trade war.
Overall, the fourth quarter is still shaping up to be fairly robust for corporate profits, with fourth quarter earnings reports from S&P 500 members so far indicating earnings growth north of 10% for the final quarter of the year. Markets, however, are more interested in what will happen to earnings growth than what has.
And while the stock market decline we saw during the final months of 2018 was certainly in anticipation of some negative news for companies about 2019, the weeks ahead will reveal just how much disappointment investors are ready to endure as we begin a new phase for the global economy.
—
Myles Udland is a writer at Yahoo Finance. Follow him on Twitter @MylesUdland
Dip Buyers Beware, the S&P 500 Bottoming Process Can Take Time
By Lu Wang
January 6, 2019, 12:00 PM MST
Past slumps since 1950 have lasted eight months on average
That’s more than twice as long as the October-December routAB’s Fisher Seeks Market Guidance From Upcoming Earnings Season
Convinced the stock rout is over? It has occasionally felt like it, on days like Friday, when the Dow Jones Industrial Average soared almost 750 points. Isolated examples of quickrebounds loom large in the minds of traders, or at least those whose careers go back more than a few years.
But even in a benign scenario — one in which a bear market is avoided and the Boxing Day low in equities is preserved — it’s wise to remember that bottoms usually take much longer to form than they have so far in the S&P 500 Index.
Here’s the data: since 1950, the S&P 500 has endured 11 retreats of 12 percent or more that happened in prolonged bull markets such as the current one, according to Bank of America. While the average decline of 19.9 percent matches the latest sell-off that started in October, the corrections have typically lingered for much longer — eight months, on average.
In other words, even if a market bottom is close in terms of equity prices, it may be too early to call all clear yet if history is of any guide. As much as bulls are hoping President Donald Trump is right — that the worst December since the Great Depression was merely “a little glitch” — past patterns suggest it isn’t that simple.
From U.S.-China trade tensions to uncertainty over Federal Reserve monetary policy, issues that were at the center of the fourth-quarter equity rout haven’t gone away. Meanwhile, bad news keeps creeping in. Apple Inc. and Delta Air Lines Inc. just joined a growing list of companies in cuttingfinancial forecasts, reinforcing fears that a slowdown in 2019 profits may be worse than analysts anticipated.“We would not describe recent action as a ‘glitch’ but instead another piece of evidence that the long, powerful U.S. bull market may have ended in late September,” said Michael Shaoul, chief executive officer at Marketfield Asset Management LLC. “We would play the market going forward by ‘bear market rules,’ which suggest that rallies generally fail below desired targets and experience their strongest gains in a few brief sessions.”
That kind of bounce is happening now. Fueled by its post-Christmas rally and Friday’s surge, the S&P 500 climbed almost 8 percent in seven days, capping its first back-to-back weekly gains since early November. The rebound, coming after the benchmark fell within points of the 20 percent bear market threshold, is reminding some investors of two previous near-death experiences.
In 1990, the S&P 500 plunged 19.9 percent in three months through October only to erase all the losses four months later. In 1998, the market took a similar dive in a matter of weeks, and again, the decline was all but forgotten in two months.
Will stocks repeat this time? They certainly could. But large-scale market dislocations seldom end swiftly. Assuming stocks had bottomed on Dec. 24, this sell-off would rank as the fourth-fastest among the 11 pullbacks tracked by Bank of America. But if it matches the average length of the past routs, stocks would face more pain into the second quarter.
“The S&P 500 has experienced the average/median pullback in terms of price but not in terms of time,” Stephen Suttmeier, a technical analyst at BofA, wrote in a note Wednesday. “A rally and retest and/or undercut phase could complete the correction in terms of both price and time.”
The S&P 500 revisited what were then 10 percent declines in October and November — and they didn’t hold. Now, past support levels have turned into hurdles.
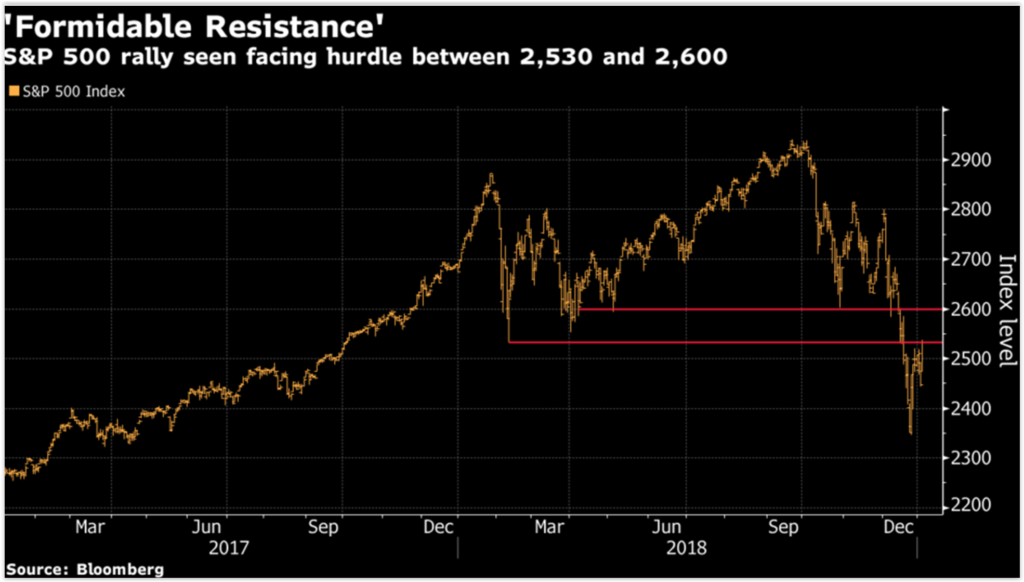
The range between 2,530 and 2,600 represents “formidable resistance” for the S&P 500, according to Jonathan Krinsky, a technical analyst at Bay Crest Partners. The former marked the market’s bottom in February while the significance of 2,600 can be seen from its ability to have stemmed losses in May and October.
After attempts to top 2,530 failed on Dec. 28 and again on Jan. 2, the S&P 500 finally broke the threshold Friday. Still, at 2,531.94, it stood one point below February’s intraday low. To Rob Ginsberg at Wolfe Research, a dip to 2,200 on the S&P 500 during the first quarter is “a fair bet”.
“Counter-trend rallies can be violent,” Ginsberg said. “But given the structural damage, it will take time for these wounds to heal.”
HI Financial Services Mid-Week 06-24-2014