
HI Market View Commentary 03-18-2019
What I want to talk about today?
Why I do what I do for work, for my investments and to “try” to help others
WHY = Because past experience has shown me that it isn’t easy, collar trading is the BEST way to invest, and because I CAN’T handle the stress of waiting for it to come back !!!!
FOR me and my investments I NEED to be able to make something on the way down so emotionally I can trade another day and because it is the best way for me to accumulate significant shares for income strategies and/or dividend payments down the road= GROWTH
TRY = I believe in Karma that what comes around goes around
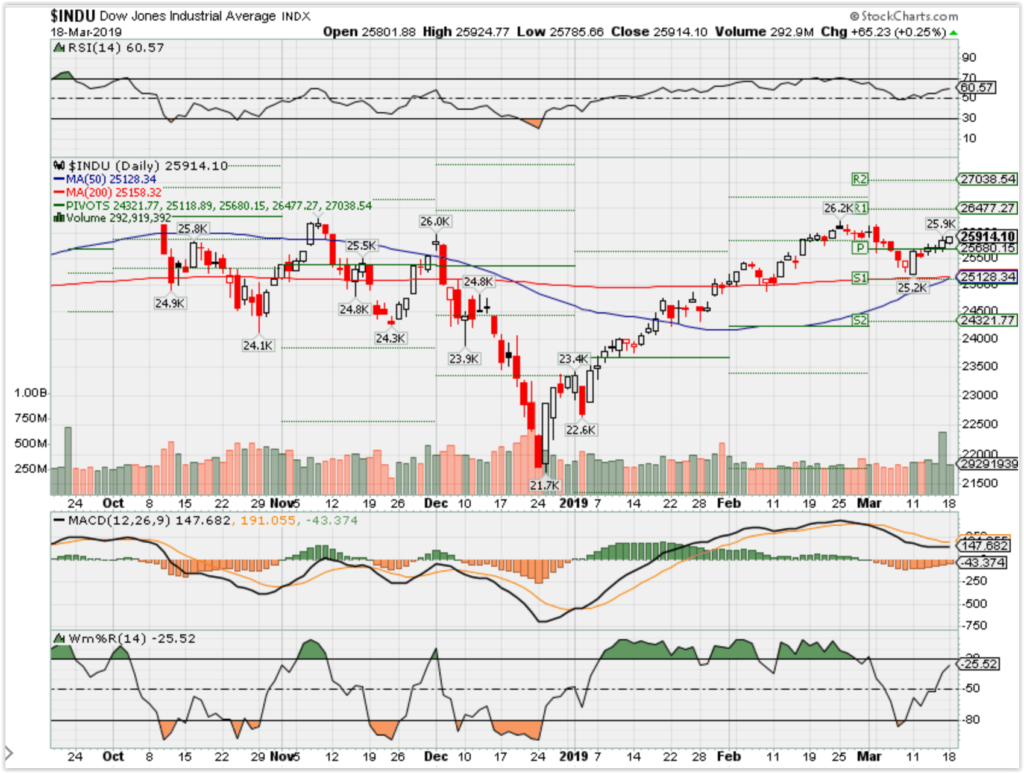
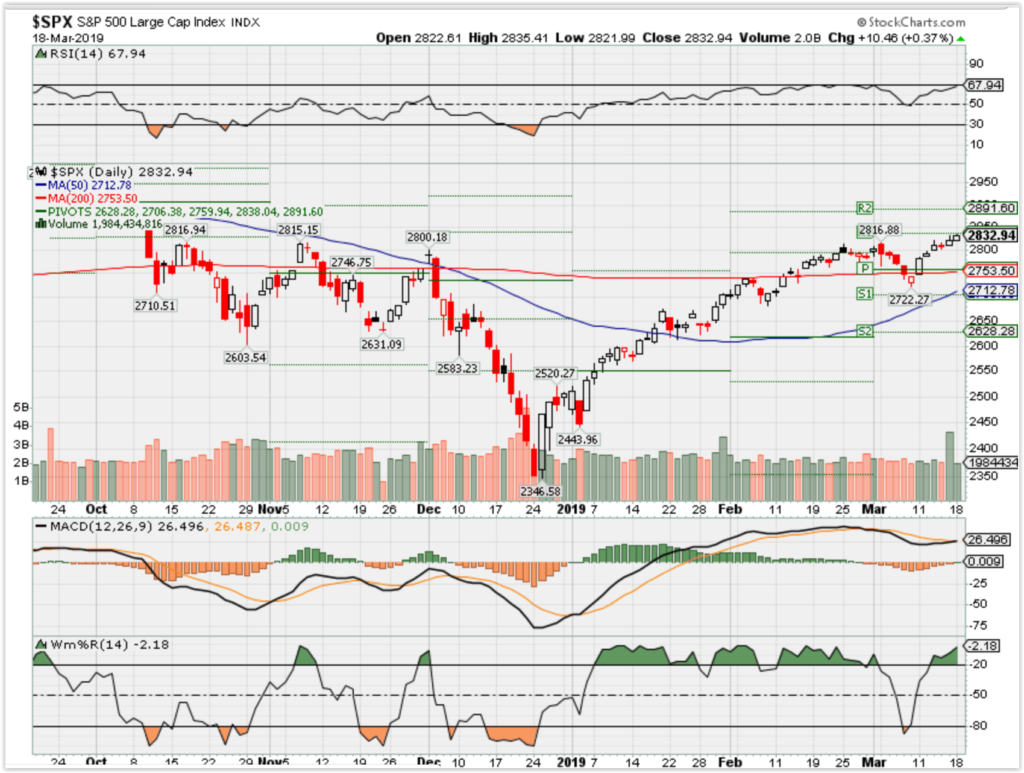
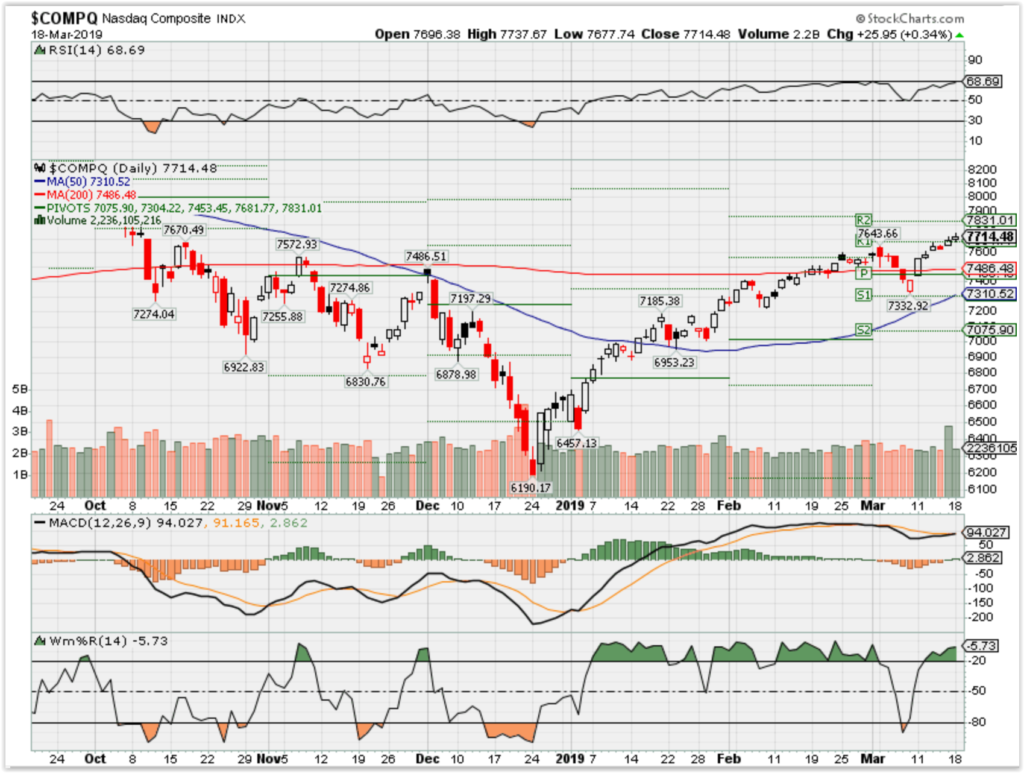
Where will our markets end this week?
Higher
DJIA – Bullish
SPX – Bullish
COMP – Bullish
Where Will the SPX end March 2019?
03-18-2019 0.0%
03-11-2019 0.0%
03-04-2019 0.0%
02-25-2019 0.0%
Earnings:
Mon: ADT
Tues: DKS
Wed: EXPR, TACO
Thur: DG, GCO, ADBE, AVGO, DOCU, JBL, TLYS
Fri: BKE, KIRK
Econ Reports:
Mon: NAHB Housing Market Index
Tues: Factory Orders
Wed: MBA, FOMC Rate Decision
Thur: Initial, Continuing, Phil Fed, Leading Indicators,
Fri: Existing Home Sales, Wholesale Inventories, Treasury Budget
Int’l:
Mon –
Tues –
Wed –
Thursday –
Friday-
Sunday –
How am I looking to trade?
Short term stock only positions
Short term spread trades
Get through monthly options expiration on this Friday
And add May options the end of March for Tax/Earning protection
RHT – 3/26
www.myhurleyinvestment.com = Blogsite
customerservice@hurleyinvestments.com = Email
Questions???
How do I see financials? They didn’t move last year when they should have with the rate hikes
21st Century Fox and Disney Announce Distribution Adjustment Multiple in Connection with Acquisition and Effect on Outstanding Shares
Mon March 18, 2019 5:18 PM|PR Newswire|About: DIS, FOX, FOXA
NEW YORK and BURBANK, Calif., March 18, 2019 /PRNewswire/ — Twenty-First Century Fox, Inc. (FOXA) (“21CF”) (NASDAQ: FOXA, FOX) and The Walt Disney Company (DIS) (“Disney”) (NYSE: DIS) announced today that the distribution adjustment multiple used to determine the portion of each share of 21CF common stock to be exchanged for common stock of Fox Corporation (“FOX”) in the Distribution (as defined below) (the “Distribution Adjustment Multiple”), has been calculated to be approximately 1.357190, in accordance with the Amended and Restated Agreement and Plan of Merger (the “Merger Agreement”), dated as of June 20, 2018, by and among 21CF, Disney, TWDC Holdco 613 Corp., the holding company that will own both Disney and 21CF following the completion of the transactions contemplated thereby, and certain of Disney’s other subsidiaries.
21CF expects to distribute, at approximately 8:00 a.m. Eastern Time tomorrow, all issued and outstanding shares of FOX common stock to 21CF stockholders (other than holders of the shares held by subsidiaries of 21CF) on a pro rata basis (the “Distribution”). Pursuant to the Amended and Restated Distribution Agreement and Plan of Merger, dated as of June 20, 2018, by and between 21CF and 21CF Distribution Merger Sub, Inc., and because the Distribution Adjustment Multiple is approximately 1.357190, 0.263183 of each share of 21CF common stock held at the time of the Distribution will be exchanged for 1/3 of one share of FOX common stock of the same class, and holders will receive cash in lieu of any fractional share of FOX common stock they otherwise would have been entitled to receive in connection with the Distribution. Following the completion of the Distribution, holders will continue to own 0.736817 of each such share of 21CF common stock, which will remain issued and outstanding until 21CF merges with a subsidiary of Disney (the “Acquisition”). The 0.736817 of each share of 21CF common stock remaining outstanding following the Distribution will be exchanged for the amount of consideration in the Acquisition that a whole share of 21CF common stock would have been exchanged for before giving effect to the Distribution, because the consideration that holders will receive in the Acquisition is automatically adjusted pursuant to the Merger Agreement to take the Distribution into account by multiplying the value of such consideration by the Distribution Adjustment Multiple.
As previously announced, 21CF and Disney anticipate the effectiveness of the Acquisition to occur at 12:02 a.m. Eastern Time on March 20, 2019.
About 21CF
21CF is one of the world’s leading portfolios of cable, broadcast, film, pay TV
and satellite assets spanning six continents across the globe. Reaching more
than 1.8 billion subscribers in approximately 50 local languages every day,
21CF is home to a global portfolio of cable and broadcasting networks and
properties, including FOX, FX, FXX, FXM, FS1, Fox News Channel, Fox Business
Network, FOX Sports, Fox Sports Network, National Geographic Channels, Star
India, 28 local television stations in the U.S. and more than 350
international channels; film studio Twentieth Century Fox Film; and television
production studios Twentieth Century Fox Television and a 50 per cent ownership
interest in Endemol Shine Group. For more information about 21CF, please visit www.21CF.com.
About Disney
Disney, together with its subsidiaries, is a diversified worldwide
entertainment company with operations in four business segments: Media
Networks; Parks, Experiences and Products; Studio Entertainment; and
Direct-to-Consumer and International. Disney is a Dow 30 company and had annual
revenues of $59.4 billion in its Fiscal Year 2018. For more information about
Disney, please visit www.thewaltdisneycompany.com.
Cautionary
Notes on Forward Looking Statements
This communication contains “forward-looking statements” within the
meaning of the federal securities laws, including Section 27A of the
Securities Act of 1933, as amended, and Section 21E of the Securities
Exchange Act of 1934, as amended. In this context, forward-looking statements
often address expected future business and financial performance and financial
condition, and often contain words such as “expect,”
“anticipate,” “intend,” “plan,”
“believe,” “seek,” “see,” “will,”
“would,” “target,” similar expressions, and variations or
negatives of these words. Forward-looking statements by their nature address
matters that are, to different degrees, uncertain, such as statements about the
consummation of the proposed transaction and the anticipated benefits thereof.
These and other forward-looking statements are not guarantees of future results
and are subject to risks, uncertainties and assumptions that could cause actual
results to differ materially from those expressed in any forward-looking
statements, including the failure to consummate the proposed transaction or to
make any filing or take other action required to consummate such transaction in
a timely matter or at all, are not guarantees of future results and are subject
to risks, uncertainties and assumptions that could cause actual results to
differ materially from those expressed in any forward-looking statements.
Important risk factors that may cause such a difference include, but are not
limited to: (i) the completion of the proposed transaction may not occur on the
anticipated terms and timing or at all, (ii) the risk that a condition to
closing of the transaction may not be satisfied (including, but not limited to,
the receipt of legal opinions with respect to the treatment of certain aspects
of the transaction under U.S. and
Australian tax laws), (iii) the risk that the anticipated tax treatment of the
transaction is not obtained, (iv) an increase or decrease in the anticipated
transaction taxes (including due to any changes to tax legislation and its
impact on tax rates (and the timing of the effectiveness of any such changes))
to be paid in connection with the separation prior to the closing of the
transactions could cause an adjustment to the number of shares of New Disney, a
new holding company that will become a parent of both Disney and 21CF, and the
cash amount to be paid to holders of 21CF’s common stock, (v) potential
litigation relating to the proposed transaction that could be instituted
against 21CF, Disney or their respective directors, (vi) potential adverse
reactions or changes to business relationships resulting from the announcement
or completion of the transactions, (vii) risks associated with third party
contracts containing consent and/or other provisions that may be triggered by the
proposed transaction, (viii) negative effects of the announcement or the
consummation of the transaction on the market price of 21CF’s common stock,
Disney’s common stock and/or New Disney’s common stock, (ix) risks relating to
the value of the New Disney shares to be issued in the transaction and
uncertainty as to the long-term value of New Disney’s common stock, (x) the
potential impact of unforeseen liabilities, future capital expenditures,
revenues, expenses, earnings, synergies, economic performance, indebtedness,
financial condition and losses on the future prospects, business and management
strategies for the management, expansion and growth of New Disney’s operations
after the consummation of the transaction and on the other conditions to the
completion of the Acquisition, (xi) the risks and costs associated with, and
the ability of New Disney to, integrate the businesses successfully and to
achieve anticipated synergies, (xii) the risk that disruptions from the
proposed transaction will harm 21CF’s or Disney’s business, including current
plans and operations, (xiii) the ability of 21CF or Disney to retain and hire
key personnel, (xiv) adverse legal and regulatory developments or
determinations or adverse changes in, or interpretations of, U.S., Australian
or other foreign laws, rules or regulations, including tax laws, rules and
regulations, that could delay or prevent completion of the proposed
transactions or cause the terms of the proposed transactions to be modified,
(xv) the ability of the parties to obtain or consummate financing or
refinancing related to the transactions upon acceptable terms or at all, (xvi)
as well as management’s response to any of the aforementioned factors.
These risks, as well as other risks associated with the proposed transactions, are more fully discussed in the updated joint proxy statement/prospectus included in the registration statement on Form S-4 of New Disney that was filed in connection with the transaction, and in the information statement included in the registration statement on Form 10 with respect to Fox Corporation. While the list of factors presented here and in the updated joint proxy statement/prospectus included in the Form S-4 and in the information statement included in the Form 10 of Fox Corporation are considered representative, no such list should be considered to be a complete statement of all potential risks and uncertainties. Unlisted factors may present significant additional obstacles to the realization of forward looking statements. Consequences of material differences in results as compared with those anticipated in the forward-looking statements could include, among other things, business disruption, operational problems, financial loss, legal liability to third parties and similar risks, any of which could have a material adverse effect on 21CF’s, Disney’s, New Disney’s or Fox Corporation’s consolidated financial condition, results of operations, credit rating or liquidity. Neither 21CF, Disney, New Disney nor Fox Corporation assume any obligation to publicly provide revisions or updates to any forward looking statements, whether as a result of new information, future developments or otherwise, should circumstances change, except as otherwise required by securities and other applicable laws.
https://seekingalpha.com/article/4248996-boeing-cheap-can-buy
Boeing: How Cheap Can You Buy It?
Mar. 15, 2019 2:29 AM ET
Summary
All the bad news is out on grounding Boeing planes.
Boeing will act quickly to put planes back in the air.
Serious sell signal at seven times normal volume.
Looking for the bottom and the pop back to the old high.
Looking for a community to discuss ideas with? Daily Index Beaters features a chat room of like-minded investors sharing investing ideas and strategies. Start your free trial today »
Boeing (BA) still has our fundamental/technical Hold signal and we don’t expect that will change. As soon as the sellers are done, the bargain hunters will come in for the move back up to the old high. The question is how low will BA go and what are the signals to look for in order to buy BA at bargain prices?
How Cheap Can You Buy BA?
BA will keep testing the bottom until the cause of the latest crash is identified. There will be some quick results on the latest crash, however complete analysis will take a much longer time. My guess is that in a couple of months we will know whether this is best-case or worst-case scenario. That will determine how cheap you can buy BA.
Right now the factor that is driving BA price lower is the unknown cause of the latest crash. There are eyewitnesses to the crash and the black boxes, so I am optimistic that we will know something in the short term. It will bounce quickly to where it was before the latest tragedy. However, if it is a design problem, that could slow down deliveries and would affect earnings this year. Longer term, the deliveries would probably pick up. In this case, it may take BA some 12 months to return to its old high. In any case, it is a win/win situation for bargain hunters. The only question is, will it return to the old high in a few months or in 12 months?
While we are waiting for the results of the investigation, let’s look at ways we can spot the bottom and buy the bargain. First, we go to our computer system and the daily report it produces for BA and all the Index stocks. Here is our “chat room” report showing stocks subscribers are following and BA is on the list, no surprise:
Our Fundamental/Technical Hold Signal
Our most important buy/hold/sell signal is found in the SID column near the center of the page. It is now 67 out of 100 or a Hold signal. If you go to the far right of the report you will see the SID score was a 94, buy signal last week. So there is a big drop in our computer rating as a result of the drop in price and high volume shown in red in those columns on the left side of the page.
In the D:S column we show the increasing Supply driving price down. There is a 20-day bar chart color-coded green for Demand and red for Supply so you can easily see the change driving price down. As you can see in the D:S column, we have an S6 rating where S9 is the worst. We consider S7,8 and 9 sell signals and we color code them red. BA does not yet have that sell signal, but I expect it will appear.
BA still has our Fund column “+Buy” signal so let us look at the fundamentals to see what they can tell us. Finviz shows us the key fundamental metrics and a nice chart.
Fundamental Target
Finviz shows the chart and the fundamental metrics just below the chart. The chart shows support right here around $377 where it closed today (Wednesday) and you could draw another support line near $340. A normal pullback to test the uptrend in the 200-day moving average would be usual on any bad news of a temporary nature and that average is at $360 on the chart. For those that use candlesticks, today’s candlestick looks like a positive reversal signal or bottoming signal, but it has to be confirmed. We will see if $360 holds. My guess is that it will.
Looking at the fundamental metrics, the first thing that struck me was the analyst’s consensus 12-month target of $444. Price was at that level, so even the slightest bad news would have resulted in a pullback. Tragic bad news brings price down to the 200-day moving average. At this price level there is a win/win situation to make 15-20% based on a conservative consensus target. You can see below the chart that analysts had targets of over $500 before this crisis.
Let’s come up with our own target. Yahoo shows the average analyst estimate of earnings this year to be $20.21. Let’s assume that short-term earnings will take a 10% hit due to delayed deliveries. That gives us about $18. The PEG is a bargain at 0.97, so no problem using the trailing P/E of 21 applied to earnings of $18 or 21 x 18 = $378. That would imply that buyers would come in around $320. As you can see on the chart, the recent bottom was $300. That could be the target in the worst-case scenario. Obviously, the market does not see that happening yet. The market has just given the first, early vote that $360 is the bottom to buy. However, the market does not yet know what the outcome of the investigation of the latest crash is. The market is still guessing.
Technical Target
Let’s look at the point and figure chart. (Now don’t go chart-phobic on me, this is simple stuff.) We are only interested in identifying support and resistance levels. This is very simply done by looking at where the xxxx columns end and where the oooo columns terminate. You can see how high it went to $444 and now we want to see how low it can go. I will tell you what it is saying. Here is the chart (and here is a link to our live charts.)
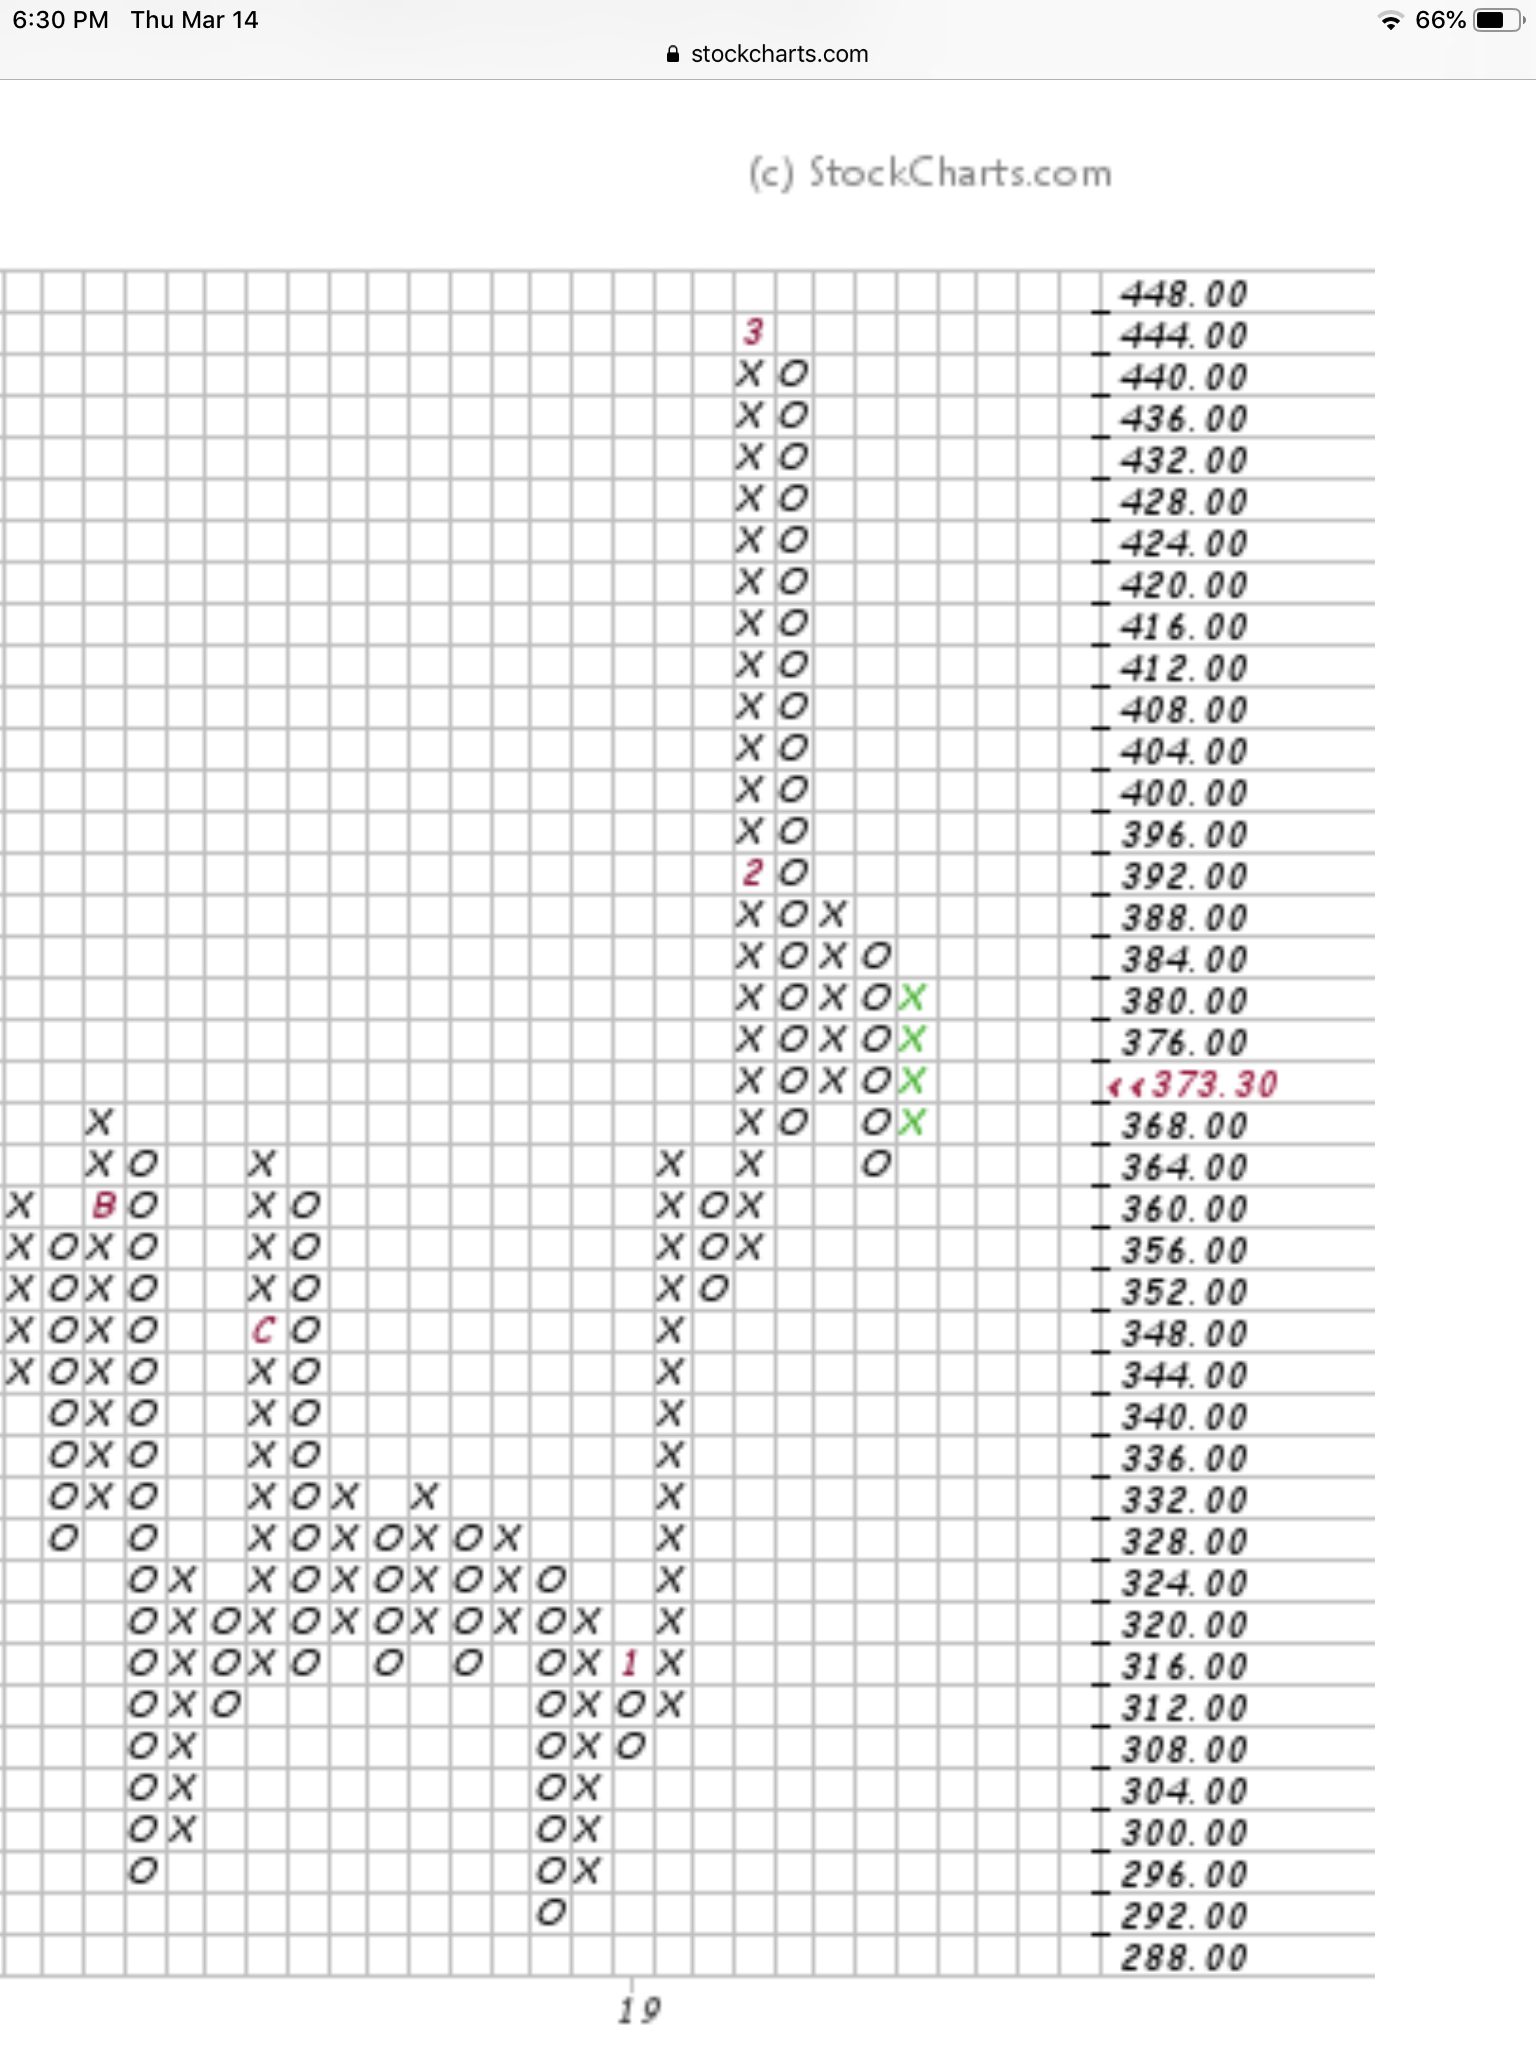
Notice the long oooo column dropping down from the $444 high and looking for a resting place or support level to bounce. This oooo column ends at $368 support and price bounces to $388 resistance shown by a new column of xxxx going up. Now the latest column of oooo is dropping looking for support. Where is that support? Support is found at the top of previous xxxx columns or the bottom of previous oooo columns.
It looks as if price is making a stand here as we noted above. Support is holding at $364 and you can see previous xxxx columns ended there. The latest xxxx column in green just took price up to $384. Today’s close is in red at $373 and dropping again. Likewise, you can see a recent ooo column ended at $352. If the market drops in March as I expect, then I think BA would test that $352 level of support again.
If the investigation turns out badly for Boeing, then you can see the next level of x and o terminations is around $330.
This chart is not magic or hocus pocus. It is simply stating the historic fact of when buyers and sellers have come into BA in the past. There is an old saying in technical analysis. There is no support when a stock is diving down until it ultimately stops diving and establishes a bottom. BA is still diving and no bottom has been established yet.
Conclusion
I think $360 is the bottom and I expect the bargain hunters to keep buying at that important support level. If the investigation turns out badly for Boeing or the next earnings report is bad, then I think price could go down to $330. In 6 months or 12 months I think BA will be retesting $444 and that makes a win/win for the bargain hunters whether they come in at $360 or $330. Our daily “chat report” shown above will give us a Confirmed buy signal in the “Cfrm” column. When we see that signal we will buy BA. We will let you know when we have that buy signal, so make sure you follow my posts.
https://seekingalpha.com/article/4248642-apple-watch-proving-big-deal
The Apple Watch Is Proving To Be A Big Deal
Mar. 14, 2019 7:00 AM ET
Summary
The Apple Watch will likely do better than I expected at picking up the slack in revenue growth caused by a declining smartphone business.
I revise my Watch sales projections for fiscal 2021, and see the product category driving one-third of Apple’s top-line growth next year.
I believe AAPL is still a bargain stock worth owning in a growth portfolio at its current valuation.
Looking for more? I update all of my investing ideas and strategies to members of Storm-Resistant Growth . Start your free trial today »
In the week of March 4th, market intelligence firm IDC published a report that made me even more optimistic about Apple’s (AAPL) future growth prospects.
The research company disclosed that the broad wearable devices market has grown a sizable 31% YOY in 4Q18. Even more relevant, the smartwatch sub-category saw its market expand by an impressive 55%, with Apple’s slice of the pie alone becoming about as large as all the other participants’ combined. According to the independent researcher, “[the Apple Watch Series 4] has been off to a very strong start and IDC anticipates this to continue as more healthcare organizations and consumers adopt the latest device.”
Credit: Apple
The news is crucial for Apple’s growth aspirations, in my opinion. As the chart below suggests, smartphones seem to have definitively entered a period of (possibly secular) decline, as the product category reaches deeper into its mature lifecycle stage. Apple has been suffering more than others in the recent few months, with iPhone softness having been the main culprit in the company’s nearly disastrous fiscal 1Q19.
On the device side of the business (i.e., excluding services and software), I have been counting on the Apple Watch to eventually pick up the slack in revenue growth driven by the smartphone business. The Cupertino-based company’s wearable device has expanded its utility to consumers as well as its addressable market by adding (1) cellular capabilities with the introduction of the Series 3 version and (2) health monitoring applications with the most recent Series 4 model. As device makers approach a ceiling in terms of how much innovation they can introduce in handheld devices, I expect wearables to enjoy perhaps the same level of growth at scale that smartphones once did, a few years ago.
However, what I have been seeing lately in terms of smartwatch sales traction has exceeded my expectations.
Source: D.M. Martins Research, using data from IDC
What the recent news means for my projections
At one point in 3Q17, possibly still influenced by “expert opinions” on how much of a flop the Apple Watch had been as a new product category, I projected that the device could generate $11.8 billion in annual revenues by fiscal 2021. About one year later, I revised my estimates up to $16 billion on the back of encouraging metrics on the Series 3’s performance.
Now, I make another round of revisions to better reflect what I perceived to be the improved opportunities in the smartwatch business. Notice here that I am purposely excluding AirPods and other wearable devices that Apple might release in the future from this analysis.
To start, I believe my previously estimated 20% YOY market growth rate in fiscal 2021 to be too low of a projection. I now think that 22% might better reflect the smartwatch environment, decreasing at a more modest pace of 25 bps per year. While smartwatch shipment increased an impressive 55% in 4Q18, I must be cautious not to extrapolate the outstanding results into future periods. I expect growth to be lumpy and driven by the successful timing of certain product releases.
Therefore, I revise my market growth projections upward for an estimated positive impact to sales of about $1 billion per year by fiscal 2021.
Then, I turn to market share. I had originally projected that Apple would reach peak market dominance at about 49%, and lose one percentage point of share per year to end up at only 44% in fiscal 2021. Today, I believe Apple is in an even better competitive position than I originally anticipated. While Apple is losing some ground to the smaller device makers that have been playing catch-up on the lower end of the spectrum, well-known brands that could give Apple a run for its money, like Fitbit (FIT), still seem to be less relevant in the space than many had imagined.
I now project that Apple will control 47% of the smartwatch space in fiscal 2021, for a positive impact to sales vs. my previous projection of roughly $750 million per year.
On the ASP side of the equation, I choose to maintain my projection of moderate improvement over the next few years, but without stretching my assumptions too thin. I understand that a scenario of tighter competition or a macro environment of less robust economic growth could put at risk Apple’s pricing power. However, if history might serve as a guide, the company has been particularly competent over the years at protecting price premium on its devices very well.
Below are my revised Apple Watch sales estimates.
Source: D.M. Martins Research, using data from company reports
Notice that, per my projections, smartwatch revenue growth of about $3.2 billion in fiscal 2020 should amount to roughly one-third of Apple’s total company consensus revenue growth that year. Not bad at all for a product category that might represent less than 5% of total sales today.
It is also worth noting that my estimates above could very well be overly de-risked, certainly compared to the much more aggressive projections disclosedby a few sell-side shops in the past months.
Final words
Although I called my readers’ attention to the importance of the Apple Watch to the company’s financial performance as early as September 2017, I did not expect the device to perform as well as it did in the 18 months that followed. I believe this is a great example of how I think Apple will be able to manage the slow decline in smartphone sales that I expect to take place over the next several years, as the market for this particular product becomes even more saturated.
Having said the above, I believe AAPL is still a bargain stock worth owning inside a growth portfolio at a current year P/E ratio of 15.9x and long-term PEG of about 1.6x (see graph below).
AAPL, a component of my “All-Equities SRG” portfolio, is only one of the names that I have discussed in more detail with my Storm-Resistant Growthcommunity. To dig deeper into how I have built a risk-diversified portfolio designed and back-tested to generate market-like returns with lower risk, join my Storm-Resistant Growth group. Take advantage of the 14-day free trial, read all the content written to date and get immediate access to the community.
Disclosure: I am/we are long AAPL. I wrote this article myself, and it expresses my own opinions. I am not receiving compensation for it (other than from Seeking Alpha). I have no business relationship with any company whose stock is mentioned in this article.
HI Financial Services Mid-Week 06-24-2014