HI Market View Commentary 10-07-2019
| Market Recap from YCharts |
| WEEK OF SEP. 30 THROUGH OCT. 4, 2019 |
| The stock market sold off early last week and, despite rallying on Thursday and Friday, ended the week lower. The S&P 500 was down 0.33% and the Dow Jones lost 0.92%, while the Nasdaq actually managed to add 0.54%. Technology climbed 1.08% and Healthcare added 0.80% to lead all sectors and Energy’s 3.77% drop dragged the market. Internationally, Developed Markets went down 1.23% and Emerging Markets similarly dipped 0.41%.
The end-of-week rally was due in part to a changing of tides for the CME Target Rate Probability tool. One week ago, the tracker gave a fifty percent chance that the Fed would lower rates at the October 30th FOMC meeting —there’s now a nearly 82% chance that rates will be cut, based on movements in options demand and prices. |
So let’s talk about our markets now for this week
China trade talks that start on Thursday – “Progress”
Impeachment of the president with a second whistle blower???
How I’m looking at the markets is that there is a lost of pent up risk!!!!
Market risk and I don’t necessarily think there are individual stocks or sectors at risk
Why do we protect ? !!!! Why do we add shares? Why do we use options to make something up to the downside?


The historical average of 7.75 “AVERAGE” return means that almost every 7.5 years you double your money
$100 * 1 + 0.0775 = $107.75
$107.75 * 1.0775= $116.10
$116.10 * 1.0775 = $125.10
$125.10 * 1.0775 = $134.79
$134.79 * 1.0775 = $145.24
$145.24 * 1.0775 = $156.50
$156.50 * 1.0775 = $168.63
$168.63 * 1.0775 = $181.70
$181.70 * 1.0775 = $195.78
Where will our markets end this week?
Up – Based on China deal progression
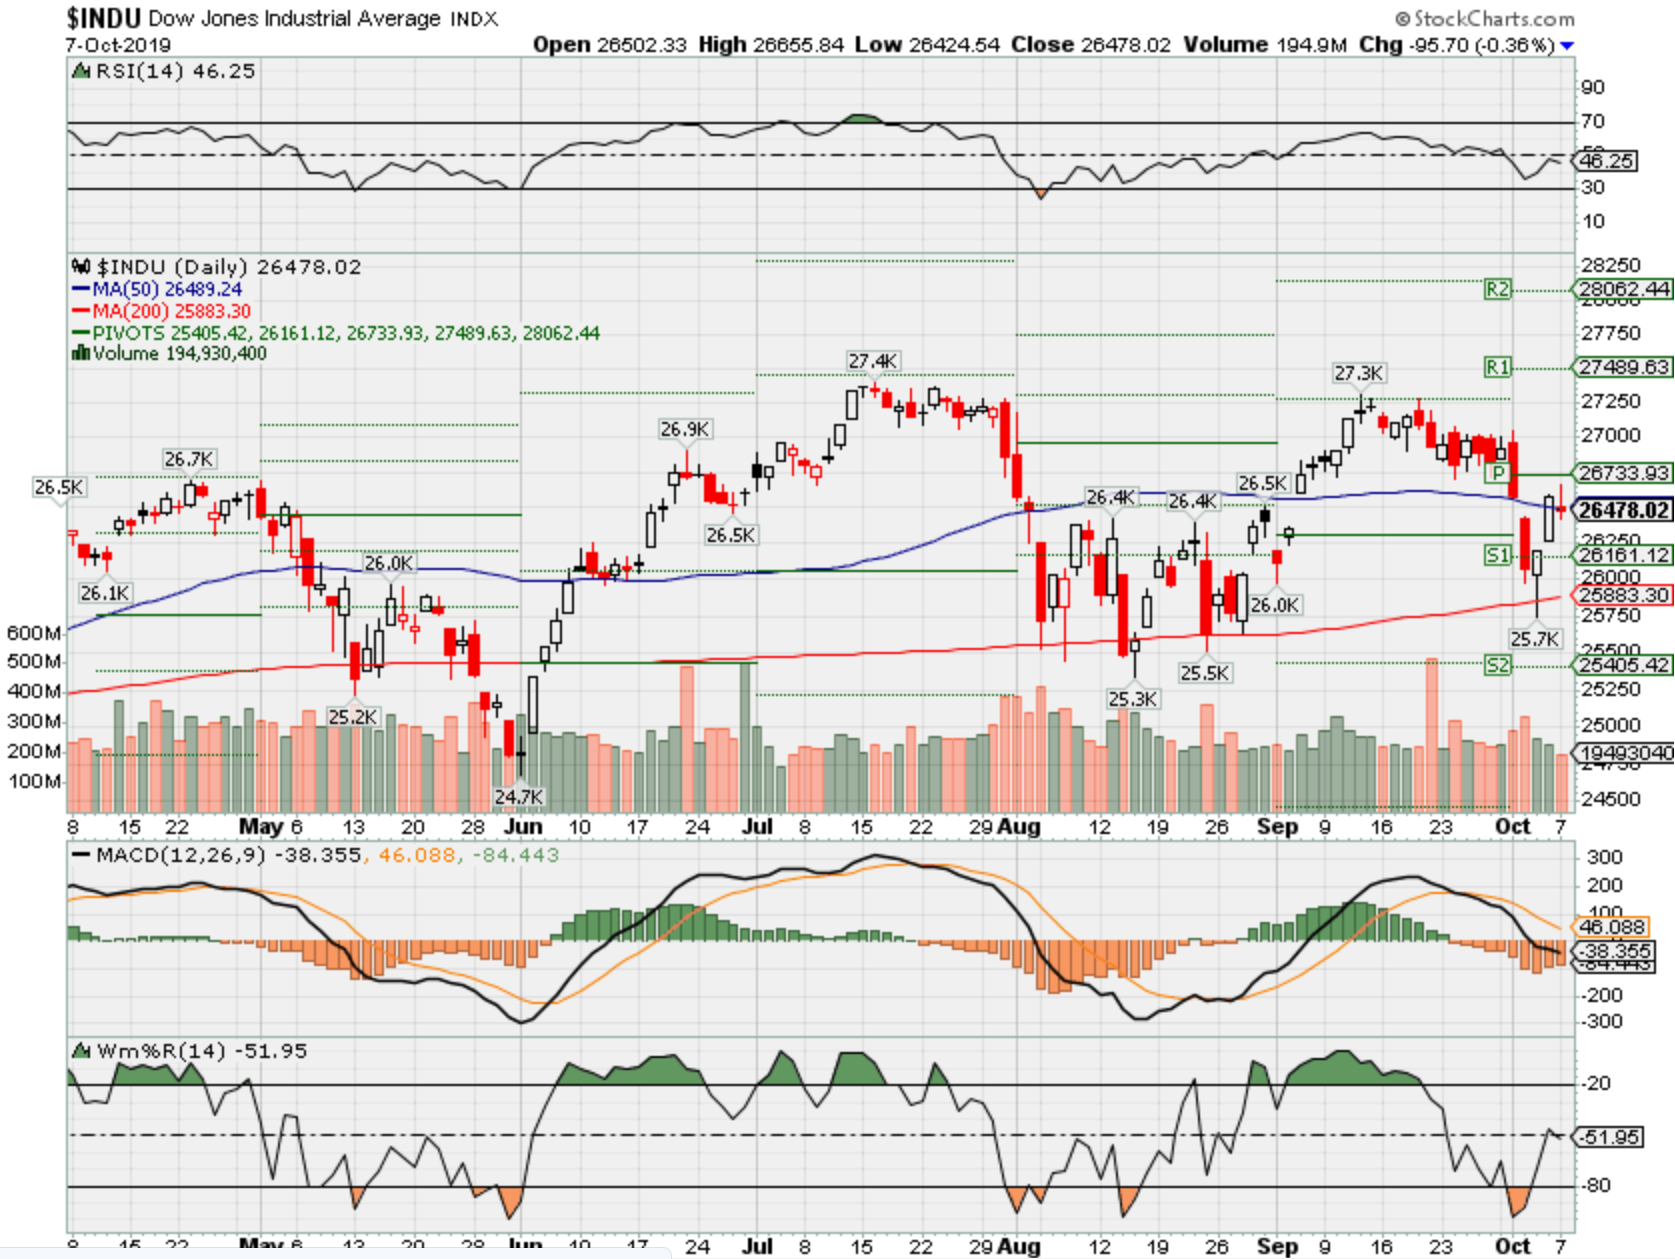
DJIA – Bearish
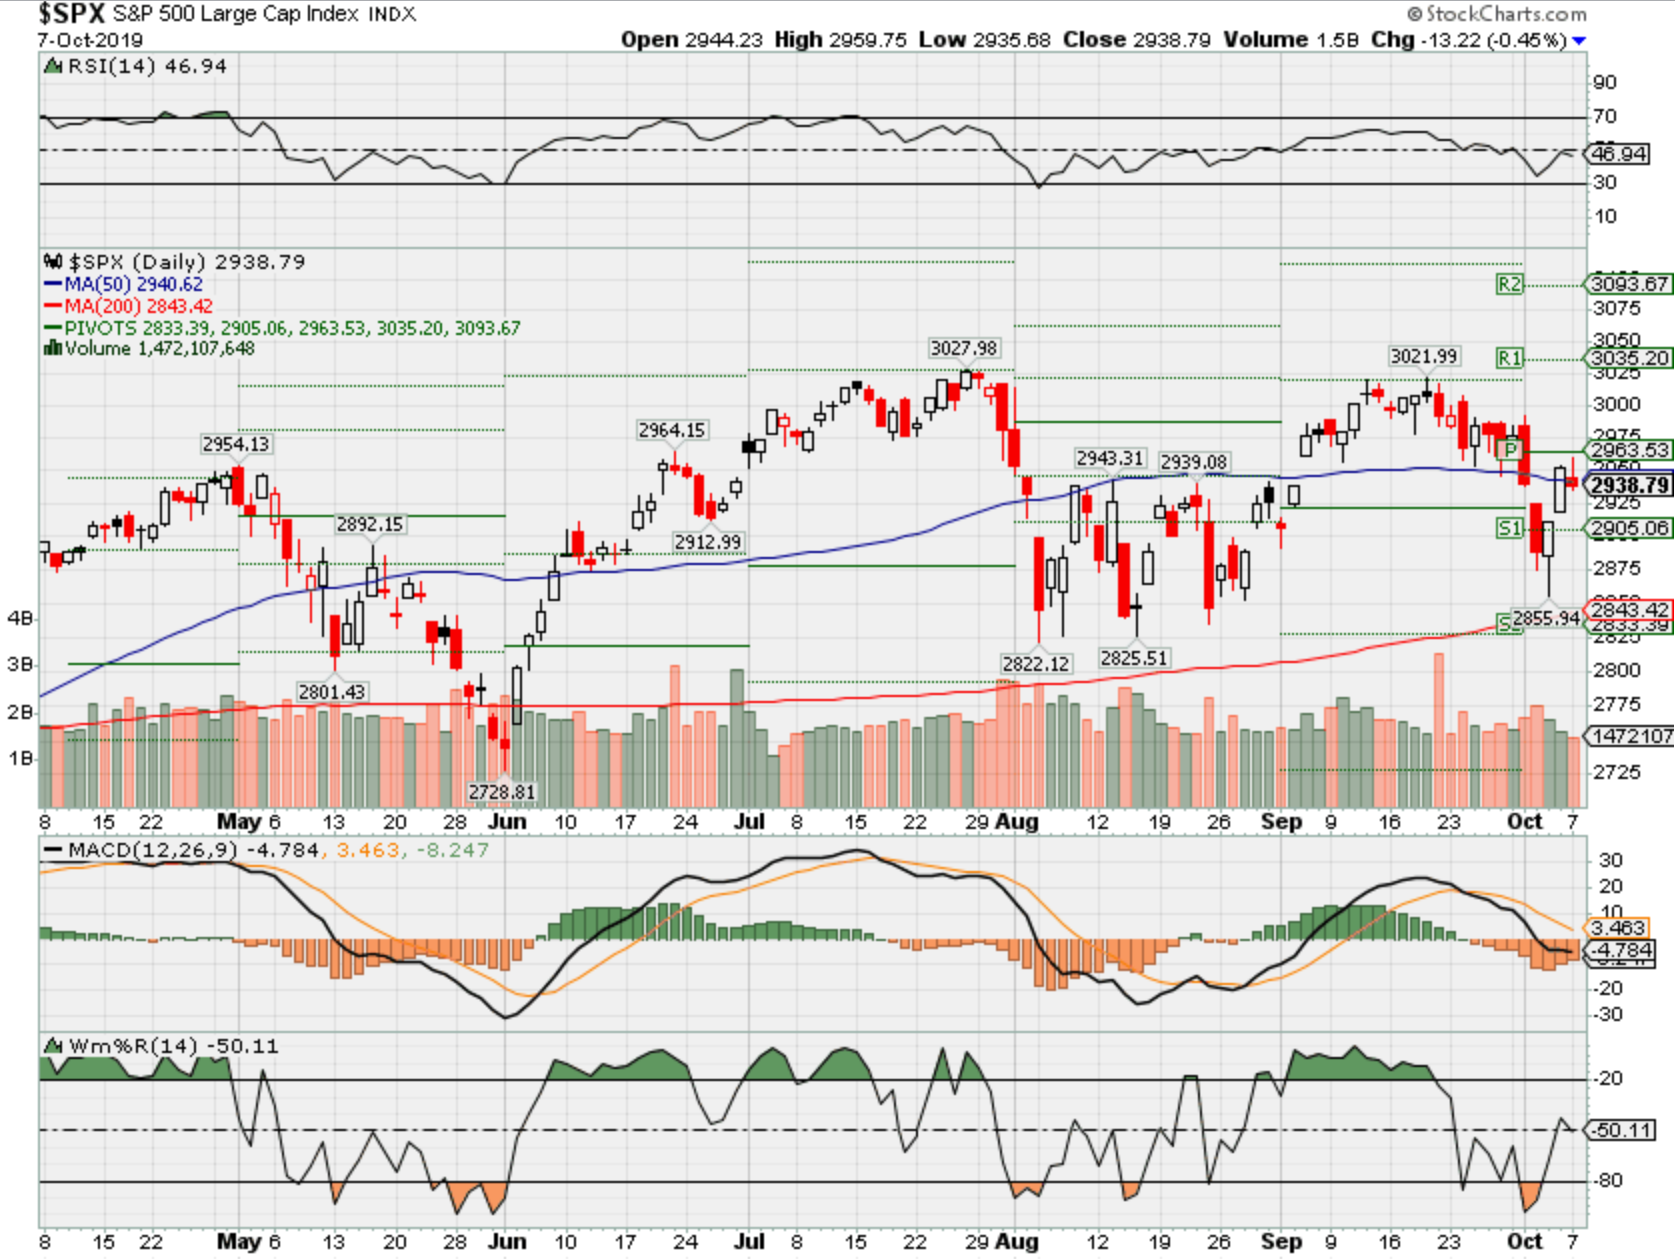
SPX – Bearish
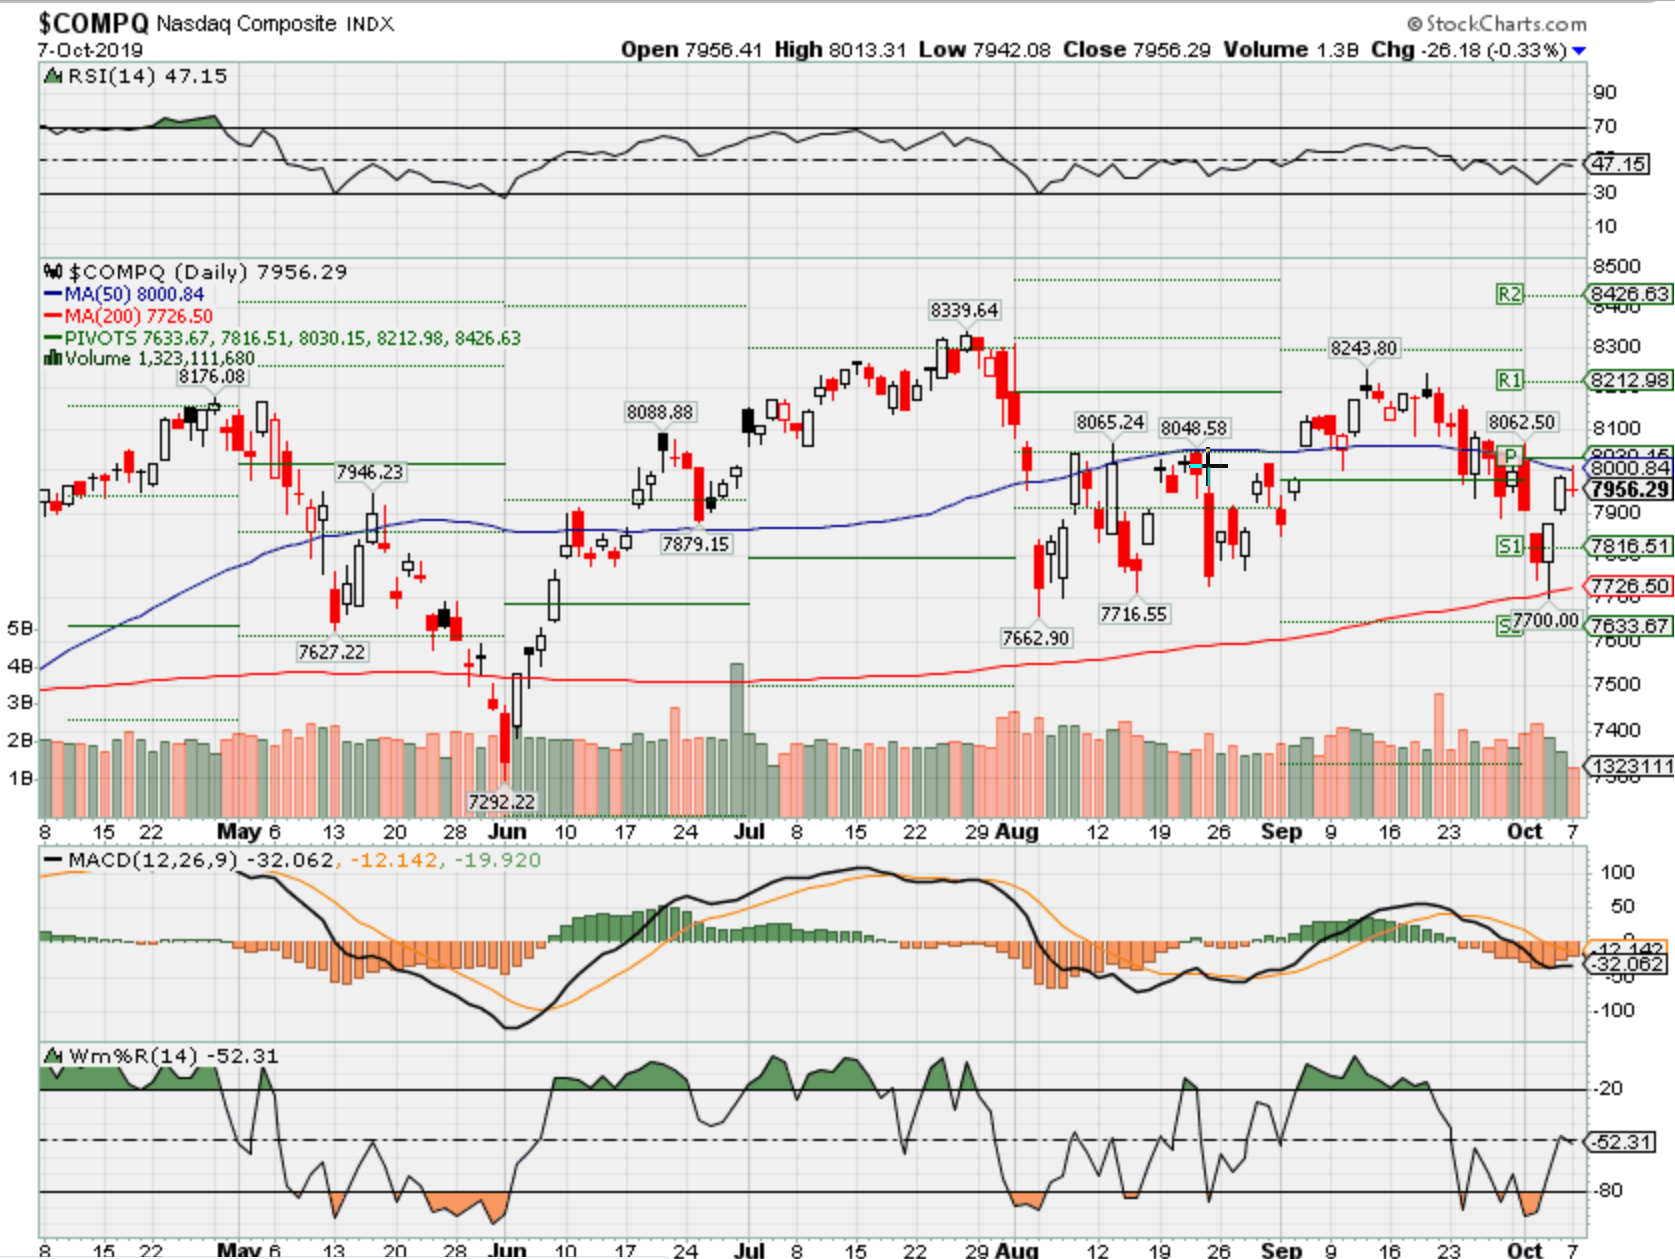
COMP – Bearish
Where Will the SPX end Oct 2019?
10-07-2019 +1.25%
09-30-2019 +1.25%
Earnings:
Mon:
Tues: DPZ
Wed:
Thur: DAL
Fri: FAST
Econ Reports:
Mon: Consumer Credit
Tues: PPI, Core PPI
Wed: MBA, Wholesale Inventories, Jolts, FOMC Minutes
Thur: Initial, Continuing, CPI, Core CPI
Fri: Import, Export, Michigan Sentiment
Int’l:
Mon –
Tues – CN: Caixin Services PMI, China Market Re-open
Wed –
Thursday – China Trade Talks
Friday-
Saturday/Sunday –
How am I looking to trade?
I’m preparing for earnings = Adding long puts
AA – 10/16 AMC
AAPL – 10/30 AMC
AOBC – 12/05 est
BA – 10/23 BMO
BIDU – 10/29 est
BAC – 10/16 BMO
CVS – 11/06 BMO
CVX – 11/01 BMO
DIS – 11/07 AMC
F – 10/23 AMC
FB – 10/30 AMC
FCX – 10/23 BMO
MRO – 11/06 est
MRVL 11/26 est
SLB – 10/18 BMO
TGT – 11/12 BMO
V – 10/23 est
XOM – 11/01 BMO
VZ – 10/25 BMO
ZION – 10/21 AMC
www.myhurleyinvestment.com = Blogsite
customerservice@hurleyinvestments.com = Email
Questions???
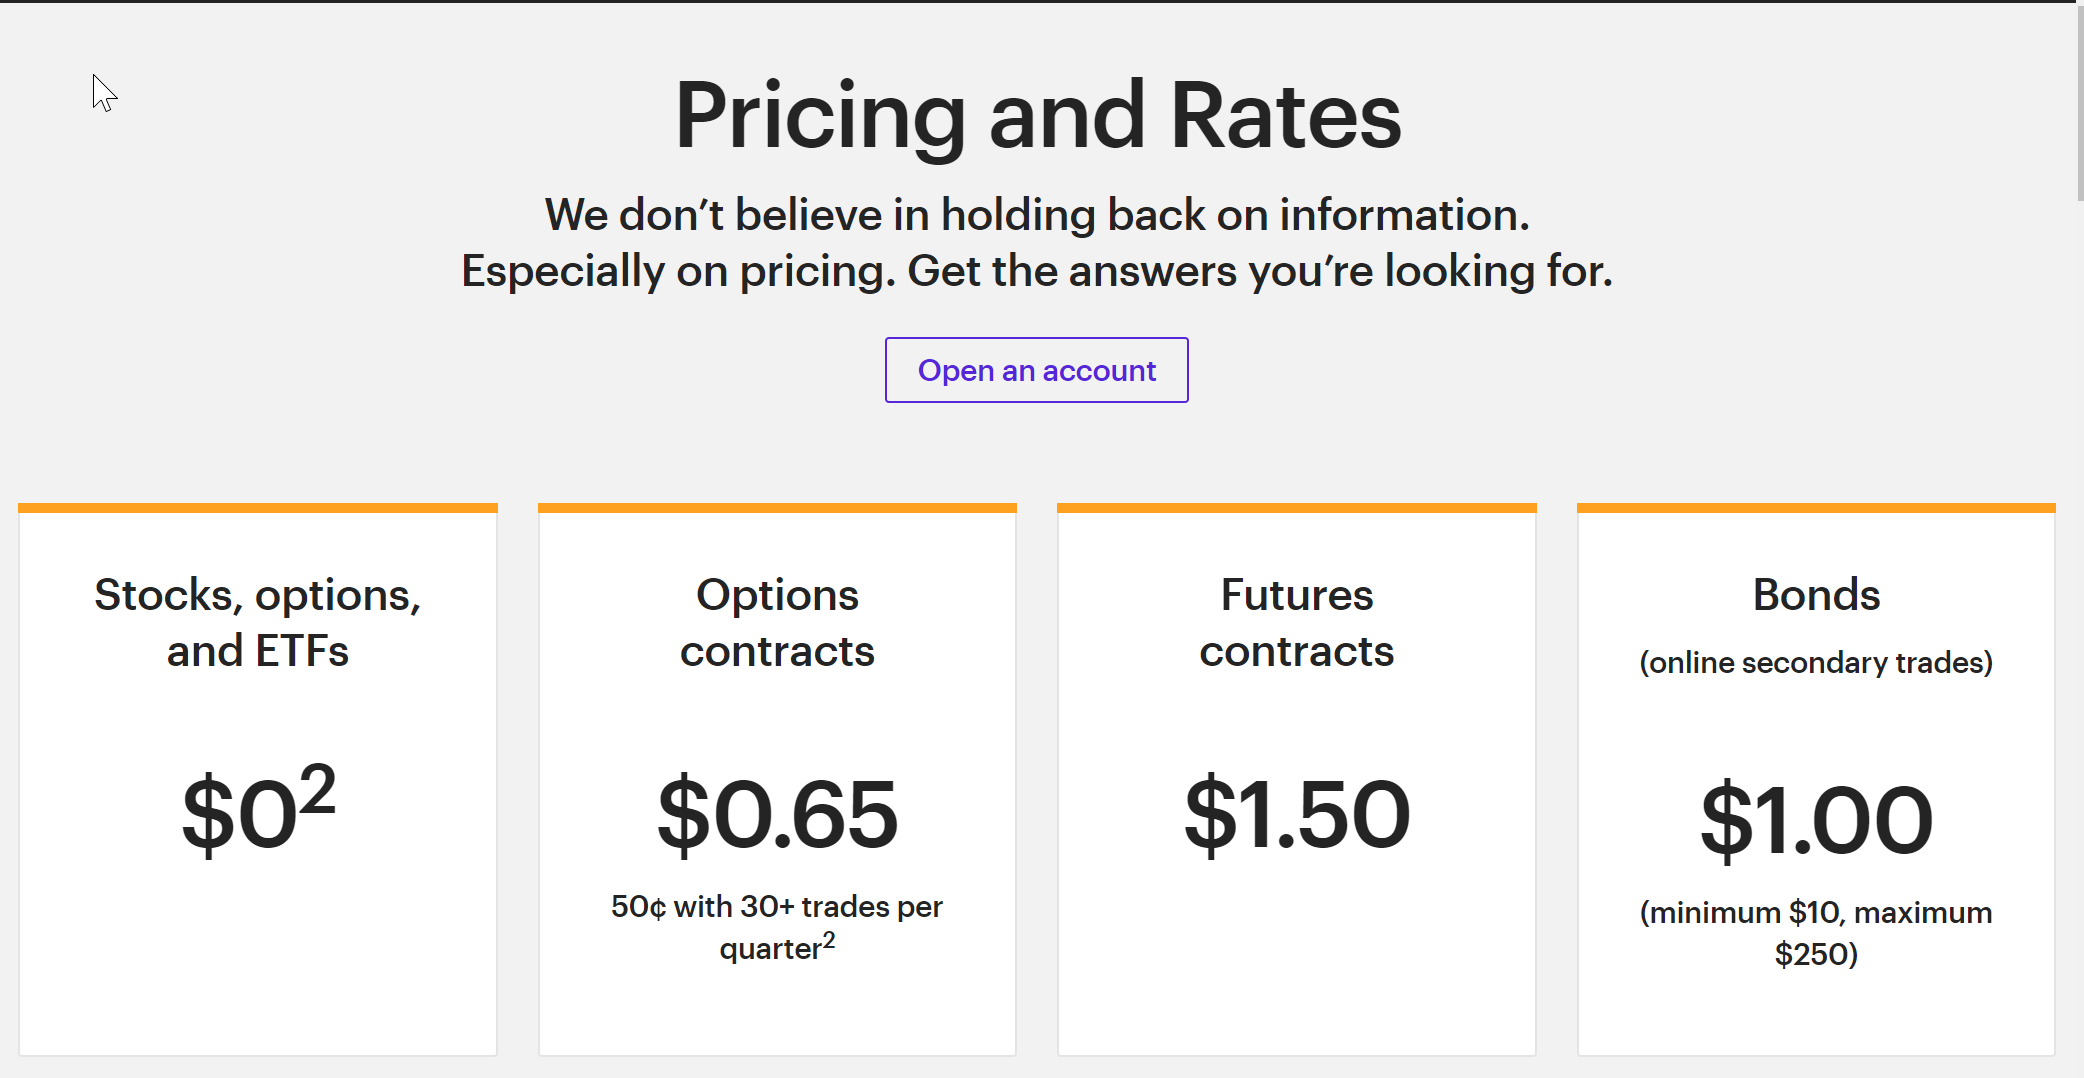
What do you think about the commissions revolution in placing trades
Today I took off BAC protection for a profit and on long calls dollar cost average
| Why Day Trading Sucks
By: Ian Wyatt
Honestly, day trading sucks. It’s a complete waste of time. What if you could easily earn 15% to 30% profits – in just 24 hours? It’s completely possible when you become an “Overnight Trader.” Back in the 1990s, it was all the rage. I remember meeting my first day trader in 1999. I was a freshman at Skidmore College in upstate New York. And I’d just read this New York Times Magazine cover story on a day trader in Washington, D.C. We met a couple months later at a private club in New York City. At the time, I was running an investing web site from my dorm room. And I was looking for contributing writers. David was a Division I hockey player at the University of Minnesota. He then went to New York University Law School. After a couple years, he quit the lawyer racket, the 90-hour work weeks, tons of travel. And the promise of at least 10 years before having a shot a “partner.” It wasn’t for David. And so, what did he do? Day trading. The New York Times story highlighted that David quickly made $230 on 500 shares of stock – within the first 15 minutes of the “work day.” And that’s what day traders used to do. Buy up shares of stock – and hope that the stock moved higher (or lower, if shorting). At the time, technical analysis – or “chart reading” – was the preferred method for picking trades. Today, day trading is even more difficult. That’s because high-frequency trading firms dominate the market – and computers recognize patterns faster than humans. Let’s face it . . . Day Trading Sucks! Join me for this week’s Overnight Trading Training – FREE Signup HERE…
Back in the 1990s, day trading was relatively simple. Today, it’s nearly impossible to make money. Here’s why . . . 1) Capital Intensive To successfully day trade, you need at least $100,000. Buying stocks – even on margin – is incredibly expensive. So, if you’re looking to earn a full-time living trading, you’ll need a sizable bankroll. Plus, you’ll want to make sure you have enough cash to survive a market downturn or a trading slump. 2) 9:30 a.m. to 4 p.m. Eastern Time The U.S. stock market is open for 6 ½ hours every day. Day traders typically want to be at a desk – watching the market – whenever they have open positions. That means watching every tick of the market. Maybe that works, if day trading is a full-time job. But it certainly doesn’t work if you want freedom. 3) Difficult to Win The advent of high-frequency trading makes this nearly impossible. In Flash Boys, Michael Lewis reveals the inner workings of the trading firms that dominate the market. These firms hired PhDs in mathematics to program computer servers to trade the markets. They exploit every possible strategy, and make it impossible for any day trader to “beat the market. Sounds like a horrible way to earn a living . . . That’s why folks are getting excited about this “Overnight Trading” strategy. Basically, it lets you get all the benefits of day trading . . . without the problems. When you become an Overnight Trader, you’ll:
Click here to become an “Overnight Trader” – starting today! Andy Crowder’s LIVE training reveals crucial details. And I’ll be there to share everything. Oh – and a few years ago, I met up with David. We had sushi together in Cleveland Park. And at the time, he’d given up day trading and was working as a lawyer once again. Don’t go backwards – click here now. Yours in Profits, Ian Wyatt |
Whatever the Future Holds, Stocks Are Not Priced for a Recession
October 6, 2019, 5:00 AM MDT
Nobody has a good record predicting the U.S. economy, not pundits and certainly not stock investors. And while a recession has been incorrectly forecast practically every day of the current bull market, when one finally comes it’s going to hurt.
Ten years of gains have fattened price-earnings ratios in U.S. stock benchmarks. Based on profits already booked, the S&P 500 currently trades at about 19.4 times income, while the Nasdaq 100 fetches 24.4 times. Those ratios arguably make sense during an expansion, especially when interest rates are so low. Should growth seize up, as it has shown signs of doing lately, look out.
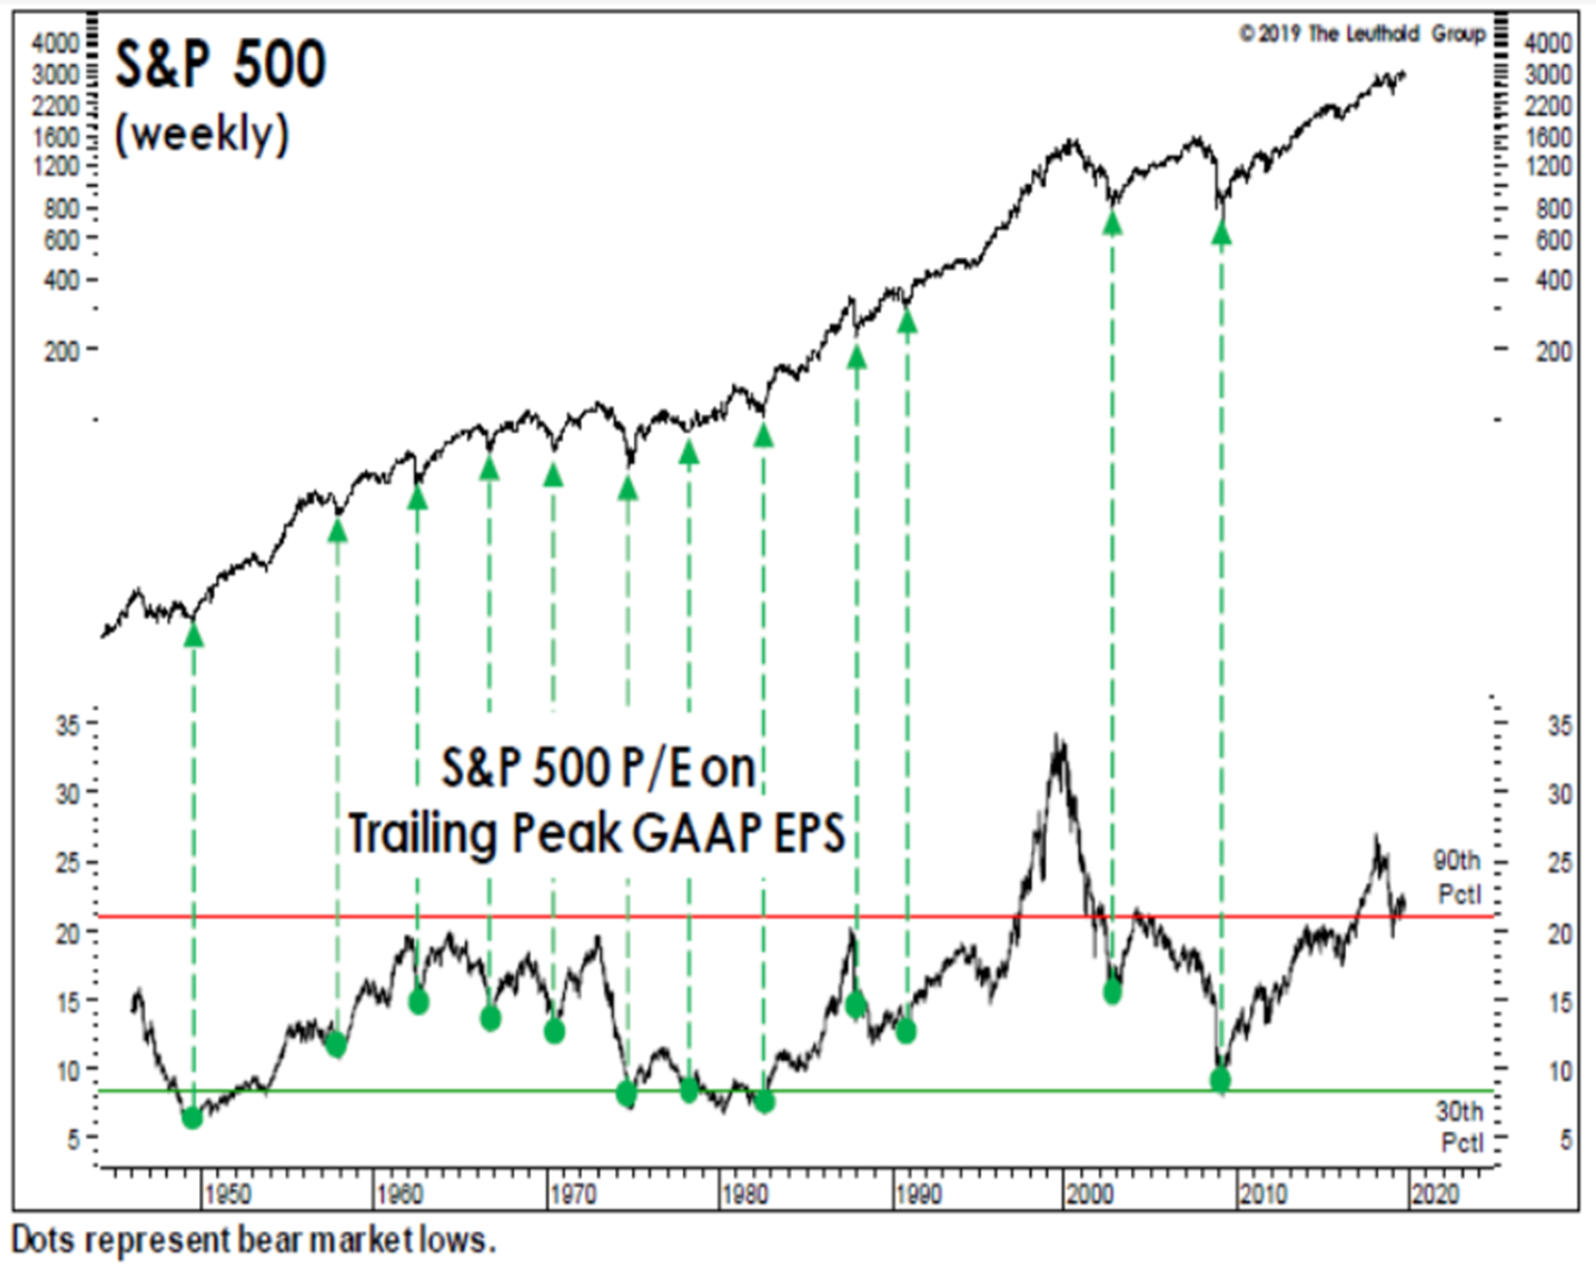
“Large-cap valuations are high, not in bubble territory, but if we do stumble into recession over the next year, which I think is likely, I think we’ll see below 2,000s on the S&P,” said Doug Ramsey, chief investment officer of Leuthold Weeden Capital Management. “It’s very easy to get there. We don’t need to assume that you go back to old bear market lows.”
Extreme view? Yes. A decline like that would be 50% worse than the crash that landed on stocks a year ago. But outcomes like the one envisioned by Ramsey are why making odds on a recession can be the only calculation that matters for equity investors, who tend to enjoy gains as long as the economy isn’t contracting.
To get a sense of just how far stocks could fall, Leuthold plotted previous S&P 500 valuation troughs versus peaks using GAAP earnings per share. (In those terms, the S&P 500 now trades within the top 10% of readings.) At the bottom of 12 bear markets over the past 70 years, the multiple has spanned 5.6 to 14.4, the latter following the dot-com burst.
Even in a scenario where the multiple fell enough to correspond with the least-bad low in that study, it would take the S&P 500 just below 2,000, according to Ramsey. With the benchmark trading near 2,950 now, that’s a 32% plummet.
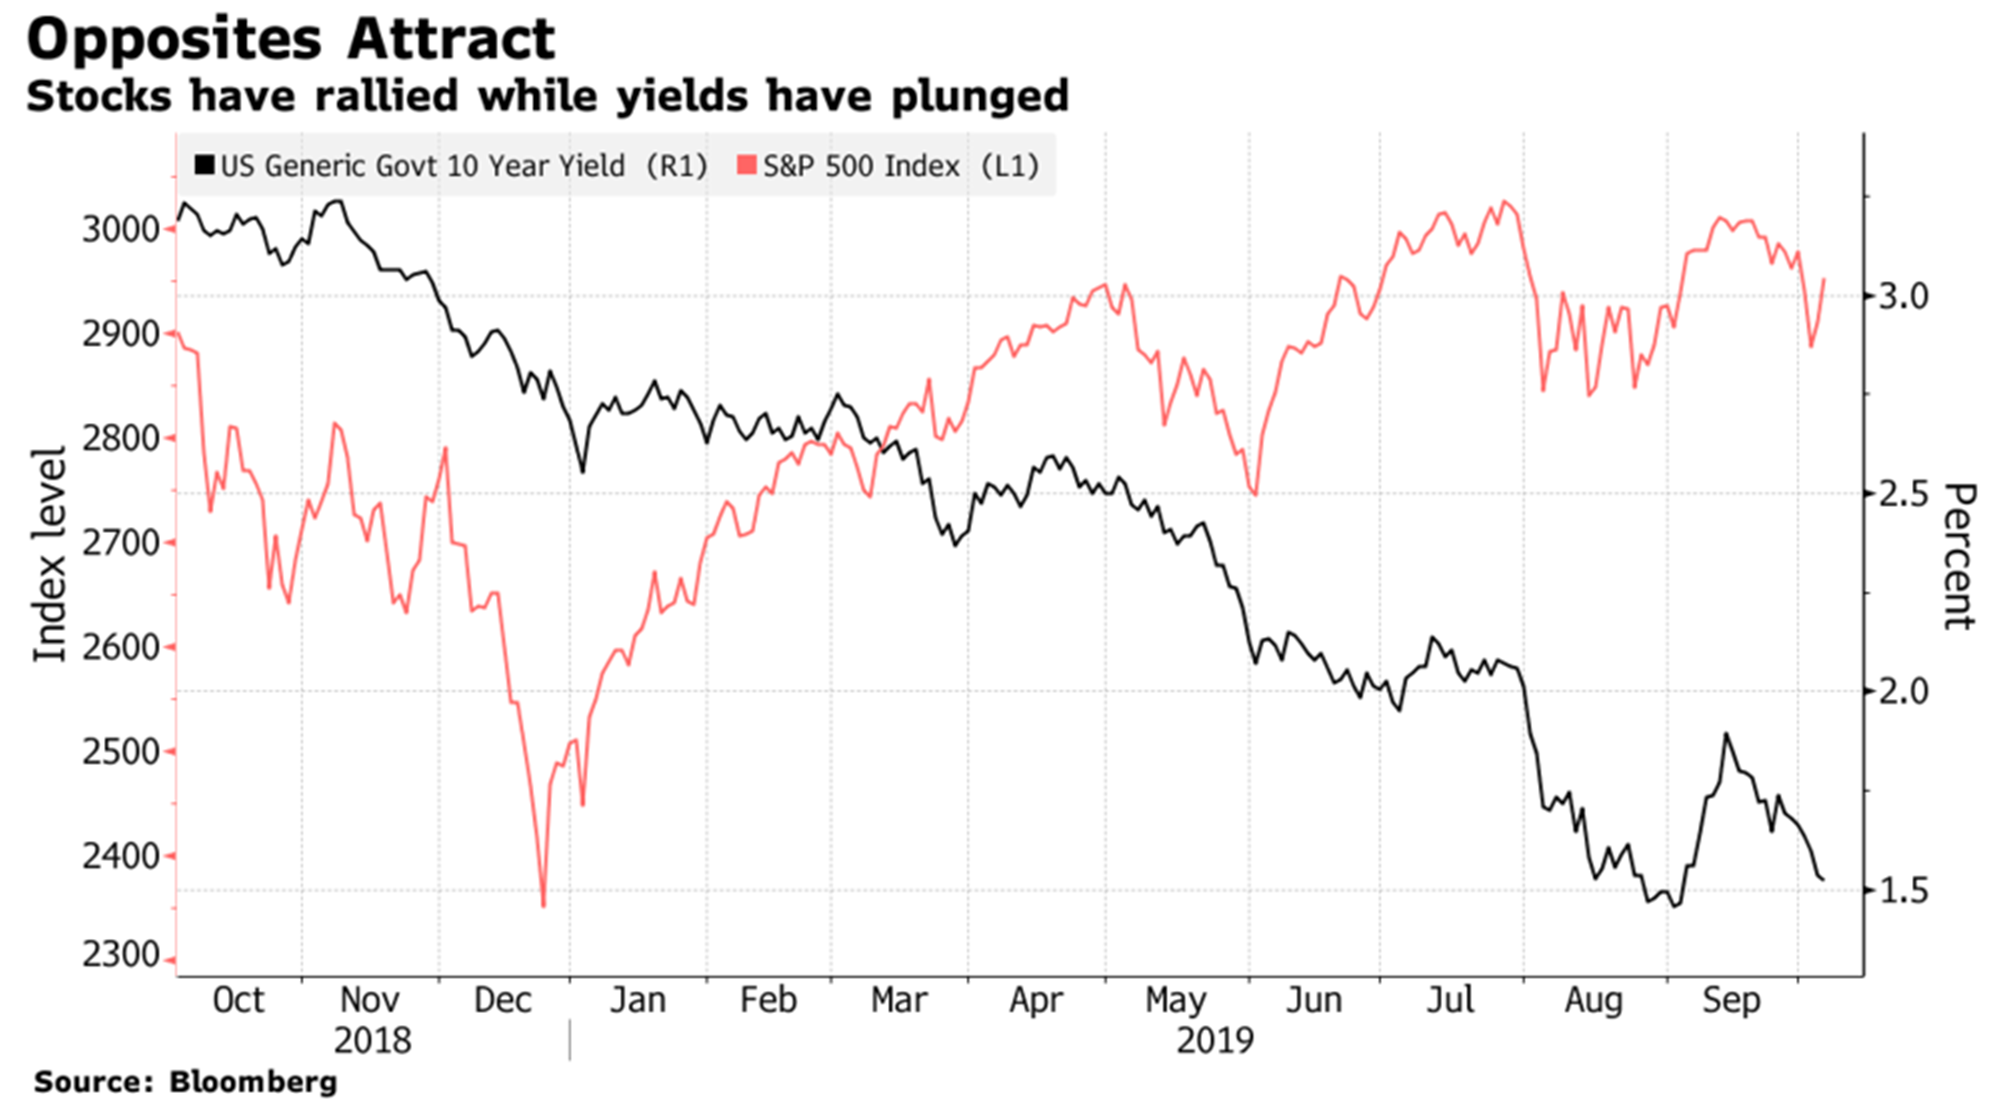
After a barrage of weak economic data prints this week, more investors are questioning the health of the U.S. economy. First came the worst ISM manufacturing reading in a decade, followed by hints of a slowing labor market and a drop in services data to a three-year low.
The S&P 500 dropped 1% for two straight days, and was on its way to a third loss of that amount Thursday before staging a rebound. After a forceful rally to end the week, the benchmark ended the 5-day period down less than half a percentage point, and only 2.4% off record highs. If the latest data is any warning of what’s to come, though, equity markets look way too expensive.
A Fed Bank of New York measure currently puts the odds of a U.S. recession over the next 12 months near 40%, the highest level of the bull market. Still, strategists and economists alike largely agree that any economic downturn won’t be nearly as bad as the financial crisis. Plus, lower interest rates mean stock valuations could remain relatively higher.
At New York Life Investments, a $578 billion money manager, strategists have been discussing the possibility that long-term averages for price-earnings multiples could actually be in the range of 24 to 25, rather than 16 to 17. In data going back to 1969, the average multiple for the S&P 500 stands at 16.8.
“We don’t expect — and many of our portfolio managers across asset classes — don’t expect a sustainable rebound in interest rates for some time,” Lauren Goodwin, an economist and multi-asset portfolio strategist at the firm, said in an interview at Bloomberg’s New York headquarters. “There’s some ‘there, there’ in terms of what does average valuation look like?”
Still, it’s not just price-earnings multiples that a growth slowdown, and potential recession, calls into question. Of course, that would bode poorly for revenue and profit growth, too. Companies in the S&P 500 are projected to grow profits next year by 10%. Investors are already skeptical that double digit earnings growth is attainable, but any slowdown could cast a shadow over any growth.
The S&P 500 currently trades at around 16.5 times next year’s expected earnings. Should no profit growth materialize though, that same valuation measure would jump above 18.
“Not only do you then have the opportunity for businesses to under-perform those expectations, but you also have the downside surprise and so that’s something that we’re really concerned about,” Goodwin said. “Earnings estimates are too rosy.”
— With assistance by Vildana Hajric, and Lu Wang
HI Financial Services Mid-Week 06-24-2014