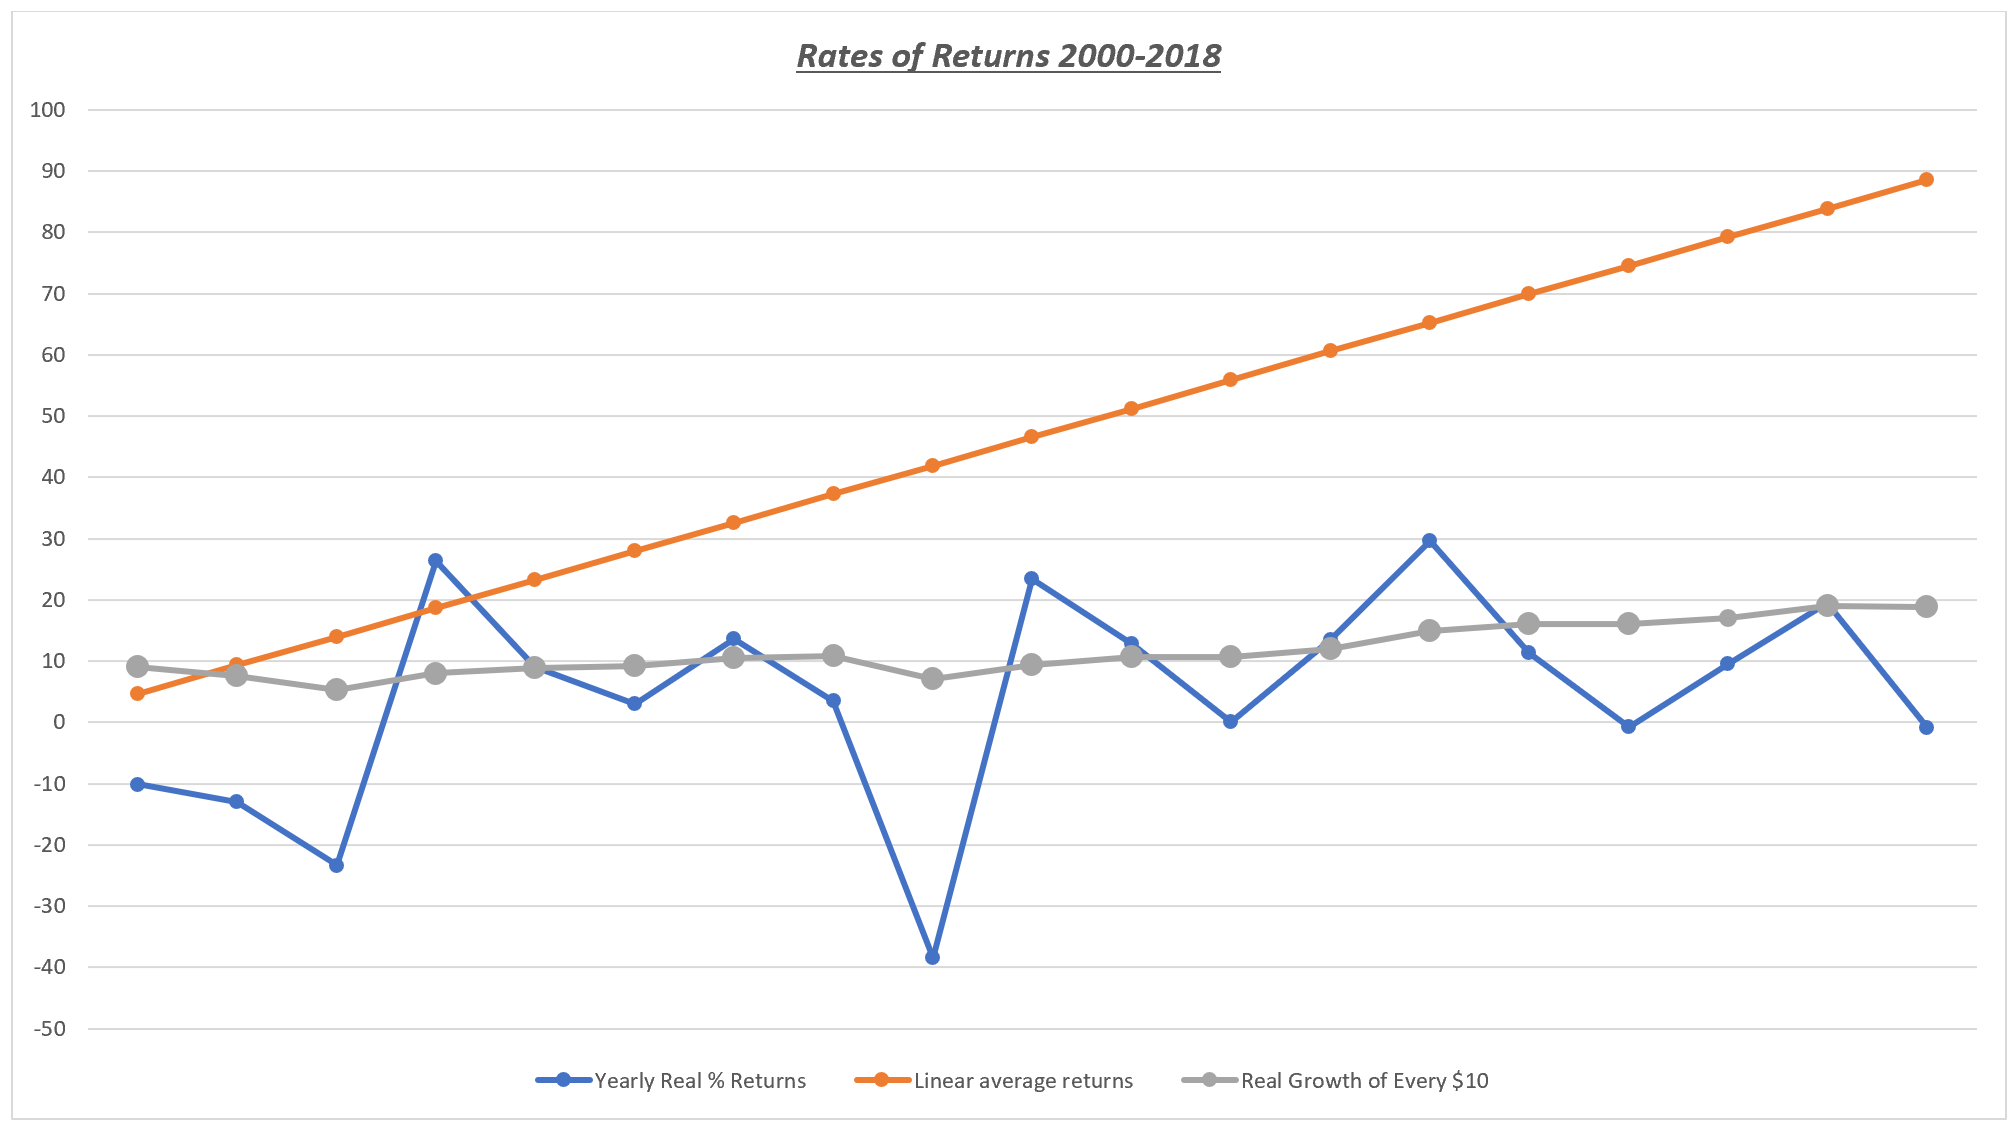
Real Rates of Return 2000-2018
Let’s talk rates of return and whether they are your friend or not. When I am talking with a new client, I am always asked my yearly average return. Let me please explain why the correct question should be, “What is your average portfolio growth?”
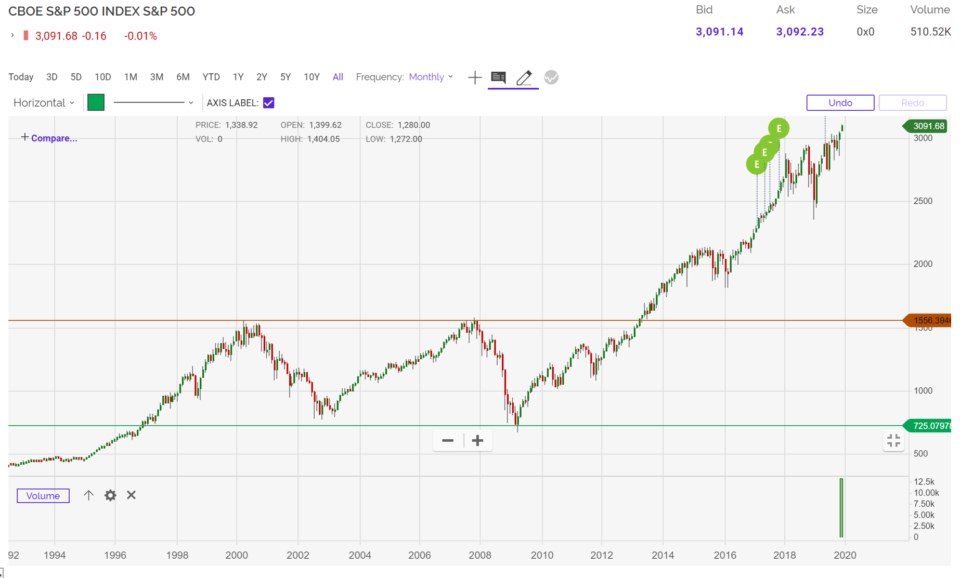
I started managing accounts in 2000, so I used the most recent returns for the S&P from the year 2000 for my example. Any advisor is trained to give a linear (orange) line rate-of-return average for the S&P 500. Most advisors give the standard 7.75% historical average since 1951, missing the great depression years.
Since 2000, the average rate of return for the S&P 500 is actually only 4.6589%. Looking back at the orange line, why do you think an advisor would use this linear average return as an expectation of future returns? Isn’t it reasonable to know, on average, how you can expect your account to grow?
Now look at the real yearly returns, which are represented by the blue line. There are plenty of down years that are below zero, and we tend to forget that those negative years leave less money to grow during the “up” years.
Real market returns are NOT linear. The relevant question you should ask your investment advisor or manager is, “How much portfolio growth have you achieved?” Why? Because every $10 you invested in 2000 is now worth only $18.88 in 2018, based on an average S&P 500 return. You have not doubled your money.
Please look at the grey line to view the growth of your $10 year by year. You have not grown the portfolio in a linear fashion. You have not even doubled your money over the expected 7.75-year period.
The truth is, for 18 years you probably have not had market growth double your portfolio. You may have added money every month in a 401K, but saving money is not the same as growing your portfolio. The numbers don’t lie when I tell you “average rates of return” are just averages and they are not your friend!


| 888-287-1030 Toll Free
www.myhurleyinvestment.com support@hurleyinvestments.com
S&P 500 Index – Historical Annual Data from: https://www.macrotrends.net/2526/sp-500-historical-annual-returns |
||||||
| Year | Average Closing Price |
Year Open | Year High | Year Low | Year Close | Annual % Change |
| 2018 | 2,758.43 | 2,695.81 | 2,930.75 | 2,581.00 | 2,651.07 | -0.84% |
| 2017 | 2,449.08 | 2,257.83 | 2,690.16 | 2,257.83 | 2,673.61 | 19.42% |
| 2016 | 2,094.65 | 2,012.66 | 2,271.72 | 1,829.08 | 2,238.83 | 9.54% |
| 2015 | 2,061.07 | 2,058.20 | 2,130.82 | 1,867.61 | 2,043.94 | -0.73% |
| 2014 | 1,931.38 | 1,831.98 | 2,090.57 | 1,741.89 | 2,058.90 | 11.39% |
| 2013 | 1,643.80 | 1,462.42 | 1,848.36 | 1,457.15 | 1,848.36 | 29.60% |
| 2012 | 1,379.61 | 1,277.06 | 1,465.77 | 1,277.06 | 1,426.19 | 13.41% |
| 2011 | 1,267.64 | 1,271.87 | 1,363.61 | 1,099.23 | 1,257.60 | 0.00% |
| 2010 | 1,139.97 | 1,132.99 | 1,259.78 | 1,022.58 | 1,257.64 | 12.78% |
| 2009 | 948.05 | 931.80 | 1,127.78 | 676.53 | 1,115.10 | 23.45% |
| 2008 | 1,220.04 | 1,447.16 | 1,447.16 | 752.44 | 903.25 | -38.49% |
| 2007 | 1,477.18 | 1,416.60 | 1,565.15 | 1,374.12 | 1,468.36 | 3.53% |
| 2006 | 1,310.46 | 1,268.80 | 1,427.09 | 1,223.69 | 1,418.30 | 13.62% |
| 2005 | 1,207.23 | 1,202.08 | 1,272.74 | 1,137.50 | 1,248.29 | 3.00% |
| 2004 | 1,130.65 | 1,108.48 | 1,213.55 | 1,063.23 | 1,211.92 | 8.99% |
| 2003 | 965.23 | 909.03 | 1,111.92 | 800.73 | 1,111.92 | 26.38% |
| 2002 | 993.93 | 1,154.67 | 1,172.51 | 776.76 | 879.82 | -23.37% |
| 2001 | 1,192.57 | 1,283.27 | 1,373.73 | 965.80 | 1,148.08 | -13.04% |
| 2000 | 1,427.22 | 1,455.22 | 1,527.46 | 1,264.74 | 1,320.28 | -10.14% |
| 1999 | 1,327.33 | 1,228.10 | 1,469.25 | 1,212.19 | 1,469.25 | 19.53% |
| 1998 | 1,085.50 | 975.04 | 1,241.81 | 927.69 | 1,229.23 | 26.67% |
| 1997 | 873.43 | 737.01 | 983.79 | 737.01 | 970.43 | 31.01% |
| 1996 | 670.49 | 620.73 | 757.03 | 598.48 | 740.74 | 20.26% |
| 1995 | 541.72 | 459.11 | 621.69 | 459.11 | 615.93 | 34.11% |
| 1994 | 460.42 | 465.44 | 482.00 | 438.92 | 459.27 | -1.54% |
| 1993 | 451.61 | 435.38 | 470.94 | 429.05 | 466.45 | 7.06% |
| 1992 | 415.75 | 417.26 | 441.28 | 394.50 | 435.71 | 4.46% |
| 1991 | 376.19 | 326.45 | 417.09 | 311.49 | 417.09 | 26.31% |
| 1990 | 334.63 | 359.69 | 368.95 | 295.46 | 330.22 | -6.56% |
| 1989 | 323.05 | 275.31 | 359.80 | 275.31 | 353.40 | 27.25% |
| 1988 | 265.88 | 255.94 | 283.66 | 242.63 | 277.72 | 12.40% |
| 1987 | 287.00 | 246.45 | 336.77 | 223.92 | 247.08 | 2.03% |
| 1986 | 236.39 | 209.59 | 254.00 | 203.49 | 242.17 | 14.62% |
| 1985 | 186.83 | 165.37 | 212.02 | 163.68 | 211.28 | 26.33% |
| 1984 | 160.46 | 164.04 | 170.41 | 147.82 | 167.24 | 1.40% |
| 1983 | 160.47 | 138.34 | 172.65 | 138.34 | 164.93 | 17.27% |
| 1982 | 119.71 | 122.74 | 143.02 | 102.42 | 140.64 | 14.76% |
| 1981 | 128.04 | 136.34 | 138.12 | 112.77 | 122.55 | -9.73% |
| 1980 | 118.71 | 105.76 | 140.52 | 98.22 | 135.76 | 25.77% |
| 1979 | 103.00 | 96.73 | 111.27 | 96.13 | 107.94 | 12.31% |
| 1978 | 96.11 | 93.82 | 106.99 | 86.90 | 96.11 | 1.06% |
| 1977 | 98.18 | 107.00 | 107.00 | 90.71 | 95.10 | -11.50% |
| 1976 | 102.04 | 90.90 | 107.83 | 90.90 | 107.46 | 19.15% |
| 1975 | 86.18 | 70.23 | 95.61 | 70.04 | 90.19 | 31.55% |
| 1974 | 82.78 | 97.68 | 99.80 | 62.28 | 68.56 | -29.72% |
| 1973 | 107.44 | 119.10 | 120.24 | 92.16 | 97.55 | -17.37% |
| 1972 | 109.13 | 101.67 | 119.12 | 101.67 | 118.05 | 15.63% |
| 1971 | 98.32 | 91.15 | 104.77 | 90.16 | 102.09 | 10.79% |
| 1970 | 83.15 | 93.00 | 93.46 | 69.29 | 92.15 | 0.10% |
| 1969 | 97.77 | 103.93 | 106.16 | 89.20 | 92.06 | -11.36% |
| 1968 | 98.38 | 96.11 | 108.37 | 87.72 | 103.86 | 7.66% |
| 1967 | 91.96 | 80.38 | 97.59 | 80.38 | 96.47 | 20.09% |
| 1966 | 85.18 | 92.18 | 94.06 | 73.20 | 80.33 | -13.09% |
| 1965 | 88.16 | 84.23 | 92.63 | 81.60 | 92.43 | 9.06% |
| 1964 | 81.37 | 75.43 | 86.28 | 75.43 | 84.75 | 12.97% |
| 1963 | 69.86 | 62.69 | 75.02 | 62.69 | 75.02 | 18.89% |
| 1962 | 62.32 | 70.96 | 71.13 | 52.32 | 63.10 | -11.81% |
| 1961 | 66.27 | 57.57 | 72.64 | 57.57 | 71.55 | 23.13% |
| 1960 | 55.85 | 59.91 | 60.39 | 52.20 | 58.11 | -2.97% |
| 1959 | 57.42 | 55.44 | 60.71 | 53.58 | 59.89 | 8.48% |
| 1958 | 46.20 | 40.33 | 55.21 | 40.33 | 55.21 | 38.06% |
| 1957 | 44.42 | 46.20 | 49.13 | 38.98 | 39.99 | -14.31% |
| 1956 | 46.64 | 45.16 | 49.64 | 43.11 | 46.67 | 2.62% |
| 1955 | 40.50 | 36.75 | 46.41 | 34.58 | 45.48 | 26.40% |
| 1954 | 29.72 | 24.95 | 35.98 | 24.80 | 35.98 | 45.02% |
| 1953 | 24.72 | 26.54 | 26.66 | 22.71 | 24.81 | -6.62% |
| 1952 | 24.45 | 23.80 | 26.59 | 23.09 | 26.57 | 11.78% |
| 1951 | 22.32 | 20.77 | 23.85 | 20.69 | 23.77 | 16.46% |
| 1950 | 18.39 | 16.66 | 20.43 | 16.65 | 20.41 | 21.78% |
| 1949 | 15.24 | 14.95 | 16.79 | 13.55 | 16.76 | 10.26% |
| 1948 | 15.51 | 15.34 | 17.06 | 13.84 | 15.20 | -0.65% |
| 1947 | 15.15 | 15.20 | 16.20 | 13.71 | 15.30 | 0.00% |
| 1946 | 17.07 | 17.25 | 19.25 | 14.12 | 15.30 | -11.87% |
| 1945 | 15.14 | 13.33 | 17.68 | 13.21 | 17.36 | 30.72% |
| 1944 | 12.47 | 11.66 | 13.29 | 11.56 | 13.28 | 13.80% |
| 1943 | 11.52 | 9.84 | 12.64 | 9.84 | 11.67 | 19.45% |
| 1942 | 8.67 | 8.89 | 9.77 | 7.47 | 9.77 | 12.43% |
| 1941 | 9.83 | 10.48 | 10.86 | 8.37 | 8.69 | -17.86% |
| 1940 | 11.01 | 12.63 | 12.77 | 8.99 | 10.58 | -15.29% |
| 1939 | 12.05 | 13.08 | 13.23 | 10.18 | 12.49 | -5.45% |
| 1938 | 11.48 | 10.52 | 13.91 | 8.50 | 13.21 | 25.21% |
| 1937 | 15.41 | 17.02 | 18.68 | 10.17 | 10.55 | -38.59% |
| 1936 | 15.45 | 13.40 | 17.69 | 13.40 | 17.18 | 27.92% |
| 1935 | 10.58 | 9.51 | 13.46 | 8.06 | 13.43 | 41.37% |
| 1934 | 9.83 | 10.11 | 11.82 | 8.36 | 9.50 | -5.94% |
| 1933 | 9.04 | 6.83 | 12.20 | 5.53 | 10.10 | 46.59% |
| 1932 | 6.92 | 7.82 | 9.31 | 4.40 | 6.89 | -15.15% |
| 1931 | 13.66 | 15.85 | 18.17 | 7.72 | 8.12 | -47.07% |
| 1930 | 21.00 | 21.18 | 25.92 | 14.44 | 15.34 | -28.48% |
| 1929 | 26.19 | 24.81 | 31.86 | 17.66 | 21.45 | -11.91% |
| 1928 | 19.94 | 17.76 | 24.35 | 16.95 | 24.35 | 37.88% |
|
|
||||||