HI Financial Services Mid-Week 03-03-2015
I used to go to Vegas and play the horses, and then I realized how ridiculous that was. There is no winning in gambling, but there is on the stock market. – Josh Brolin
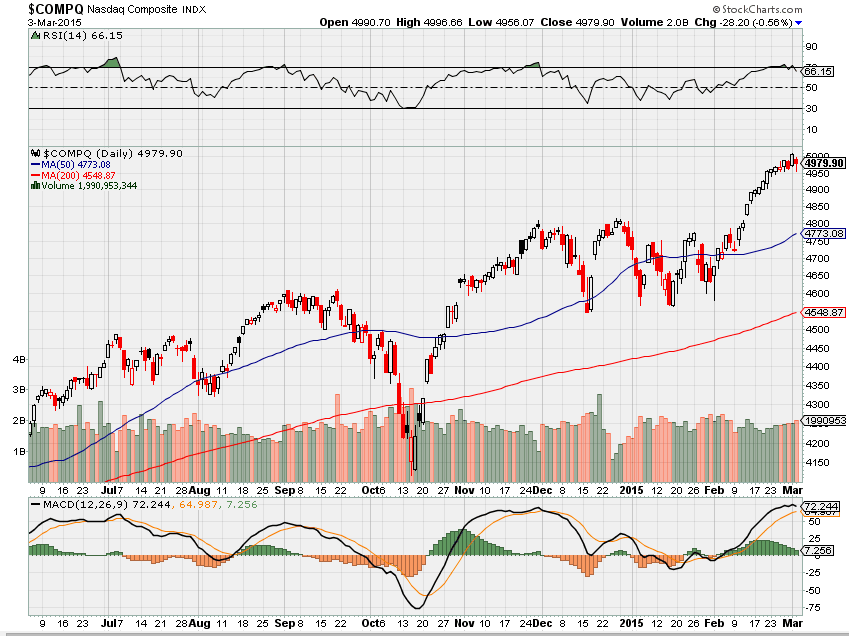
Third time EVER the Nasdaq closed above 5000 !!!!!!!!!!!!!!!
Prime Minister of Israel told us just how it is in the real world !!!!!!!!!!
Don’t Give Up 260% Gains Because of This Market Myth
Keith Fitz-Gerald Feb 27, 2015
Amazon, Apple, Cisco, Barnes & Noble, and hundreds of other companies are at fresh 52-week highs, leading many investors to question the wisdom of putting more money to work.
Yet that’s exactly what you should be doing.
I know it seems counter-intuitive – especially if you believe in buy low and sell high like I do – but here’s the thing…
…the markets are always making new highs.
It’s how you deal with them and how you pick the companies with the potential to go even higher that separates the winners from the losers.
I’m going to prove that to you right now.
And then I’m going to show you three tactical criteria you can use to judge for yourself whether something you want to buy “makes the grade.”
Here’s why market highs alone can’t be a deal-breaker for you.
Market Highs Are the Norm
People tell me all the time that they don’t want to buy anything, especially with the markets near all-time highs. I get where they’re coming from.
But here’s the thing.
The markets are almost always at or near all-time highs. That’s how they work. Over time there’s a very powerful upward bias that mirrors the amount of capital that’s constantly chasing quality companies.
To put this in perspective, consider that according to Ric Edelman, president of Edelman Financial, the markets achieve new highs – on average – roughly once every 18 days.
I know that sounds like a loaded statement and you’re right… it is. But I am sharing this with you for a reason – even the lows of 2003 and 2008 were all-time highs compared to the markets in 1990 or 1972. It’s your perspective that changes.
My point is that the overwhelming majority of people who try to time the markets based on a combination of emotion and whether they think it’s high or low usually wind up getting it backward.
Not surprisingly, they doom themselves to pitiful returns.
From 1993 to 2013, for example, the average individual investor trying to guess which direction things were going performed so poorly that they lagged behind every asset class save three: EM Asia, inflation, and Japan.
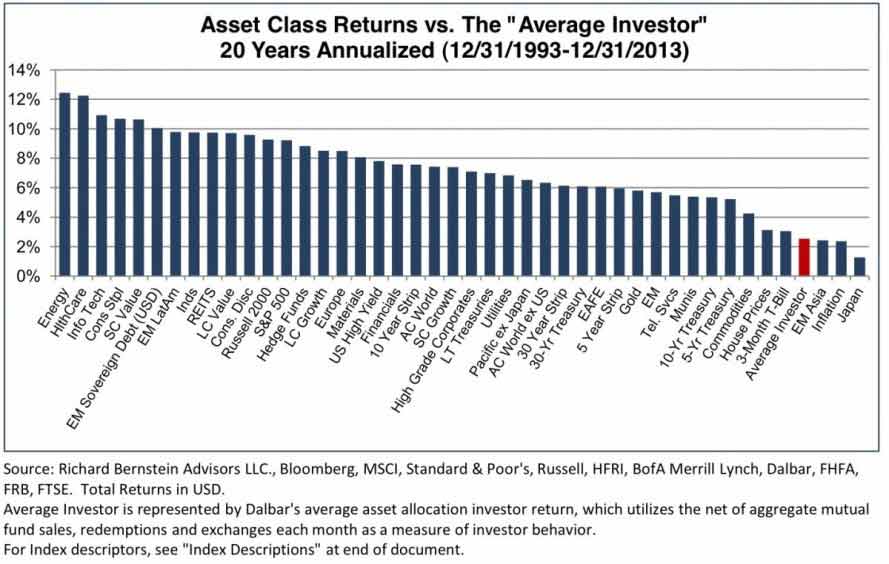
There are a couple of ways around that, but none is more powerful than buying a strong, growing company tapped into one of our unstoppable global trends even when it’s at or near 52-week highs.
Consider Altria Group Inc. (NYSE:MO).
I recommended the company on February 23, 2010, and got more than a few questions from incredulous observers and some readers wondering if I’d finally lost my marbles.
Turns out that folks weren’t concerned with the fact that big tobacco was under tremendous legal pressure. Nor did they care that anti-smoking groups were gaining ground and threatening revenues.
No… what troubled most readers and analysts even more was the fact that Altria was only pennies away from 52-week highs. To their way of thinking, the fact that it was tapping new higher prices meant that the stock was ready for a fall.
Obviously that didn’t happen. Since then the stock has returned 267%. By comparison, the S&P 500 and Dow have tacked on still impressive, but much smaller, gains of 94% and 77%, respectively.
The Downfall of Market-Timers
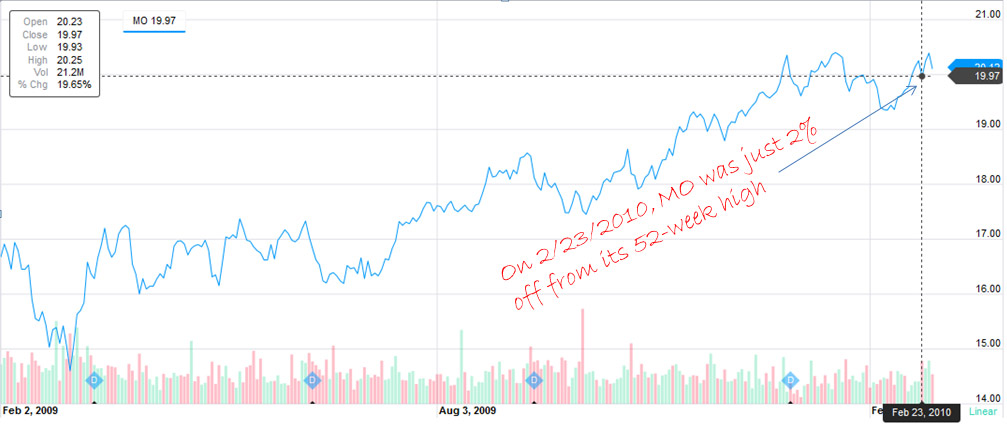
Source: Yahoo!Finance
Market-timers fail because they let emotional input override logical information. That’s why the fear of buying right before seeing a stock float back to earth stops them making sound investment decisions.
Do you really want to let your wealth suffer like that? Not if I can help it.
The harmful effects of letting emotion determine your investing decisions has been well-documented. According to DALBAR, the average investor who let emotion guide him saw an annual return of 1.9% in the 20 years before 2009, while the S&P 500 averaged 8.4% annually in the same period.
More recent figures are no better. The latest DALBAR research shows that the average investor saw annual gains of 5.02% for the 20 years leading up to 2014, even as the S&P 500 returned 9.22% annually. That’s serious underperformance rooted in emotion.
Investors who shy away from stocks that are pushing yearly highs based just on their price are forgetting one of Warren Buffett’s greatest observations: It’s better to buy a fantastic stock at a fair price than it is to buy a fair stock at a fantastic price.
I couldn’t agree more.
How to Determine Real Discounts
None of this is to say that I don’t value stocks that are cheaper than they should be. I hunt for them every day, whether the markets are tapping new highs like they are now or plumbing new lows like they were in 2003 and again in 2008.
You just need to know how to recognize the entry points.
My favorite tool is the humble P/E ratio. Also known as a price multiple, it’s a handy measure tracked by every major internet investing site of note and a quick way to gauge whether or not a stock you’re interested in is “expensive” or “cheap.”
In Altria’s case, I recommended it when it was trading at 12.56 times the prior four quarters’ worth of earnings. That might seem steep, especially considering the fact it was near its 52-week high, but to me it signified future upside. The reason? The 12.56 P/E ratio actually represented a 35% discount from the S&P 500′s average P/E at the time.
Some analysts like to look at the forward P/E ratio, which uses forecasted earnings to calculate the relative price appeal of a stock price. Altria’s forward P/E ratio was an even more attractive 9.59 when I recommended it – more proof to me that the company had profitable days ahead.
There’s also the Price/Earnings to Growth (PEG) ratio. I like the “peg” because it can tell you a lot about how the markets are valuing the company versus its earnings growth rate. PEG readings lower than 1 suggest the price is attractive, while readings higher than 1 suggest you are paying a premium for earnings growth. But again, context is important.
In February 2010, Altria was coming off a period of average annual earnings per share growth of 9.7%, making its PEG ratio equal to 12.56 divided by 9.7, or 1.3. That figure was confirmation to me that the stock was rising in line with its growth prospects, and not above it even though the market already thought it “rich.”
What about a contemporary example?
No doubt you know that Apple Inc. (NasdaqGS:AAPL) is on a tear.
The stock has tacked on some $75 billion since early February, and its total market capitalization now stands at $760 billion. Anybody thinking about buying has to be asking themselves this question: “Am I getting a good deal at these prices?”
The numbers suggest you are if you’re a long-term investor.
Apple boasts a P/E ratio of around 17 today… which is barely half that of the industry average, according to Yahoo!Finance. When accounting for forecasts up through the 2016 fiscal year, forward P/E is a respectable 14.07. The PEG ratio is 1.17.
In other words, it may still be very much a “Buy” despite its recent surge in price.
The Ultimate Litmus Test
At the end of the day, the stock market is filled with ups and downs, so there’s no way to predict with absolutely certainty that a company’s performance will continue. Or that it won’t.
Ultimately, you’ve got to a) remove emotion from the process and b) make decisions based on logic.
Even if what you want to buy is making yet another 52-week high.
Until next time,
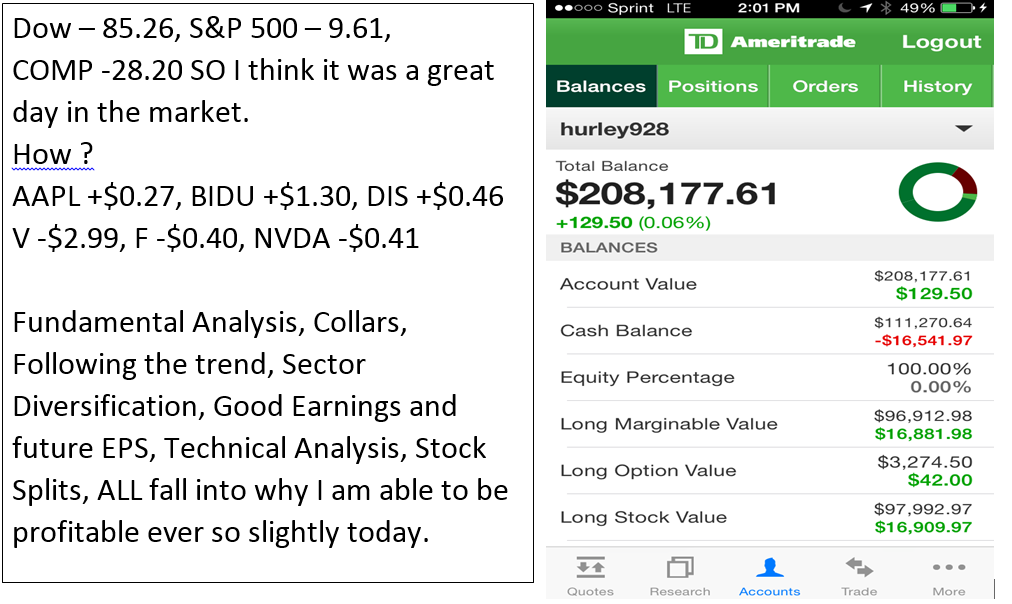
Let’s go over anything you want to today?
Can you be profitable today and why?
Let’s go over trading psychology –
Today my weather was this
If your trade looks so bleak the first day or today what do you do?

Jumping to another trade and booking a loss can look like Huntington Beach today? My favorite surfing spot had the same weather that I had at home in Alpine UT. SNOW! Sometimes jumping out quickly and jumping back into a trade gives you exactly the same result. A LOSS!


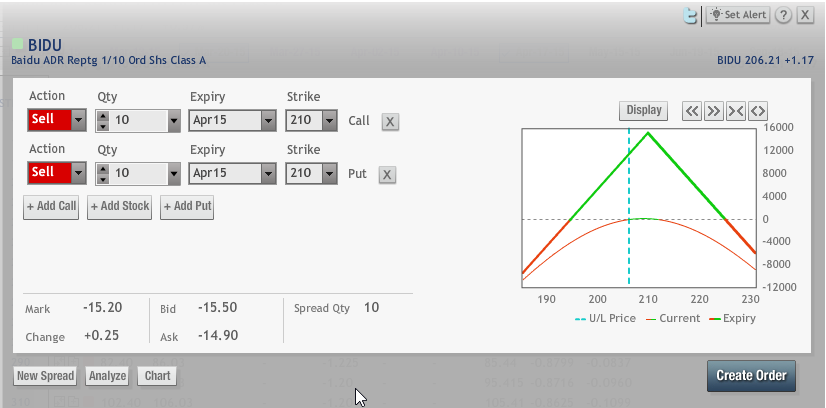
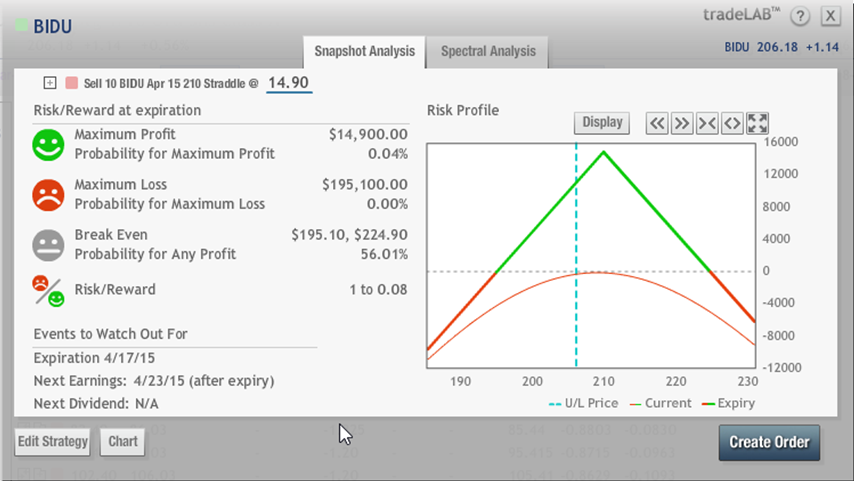
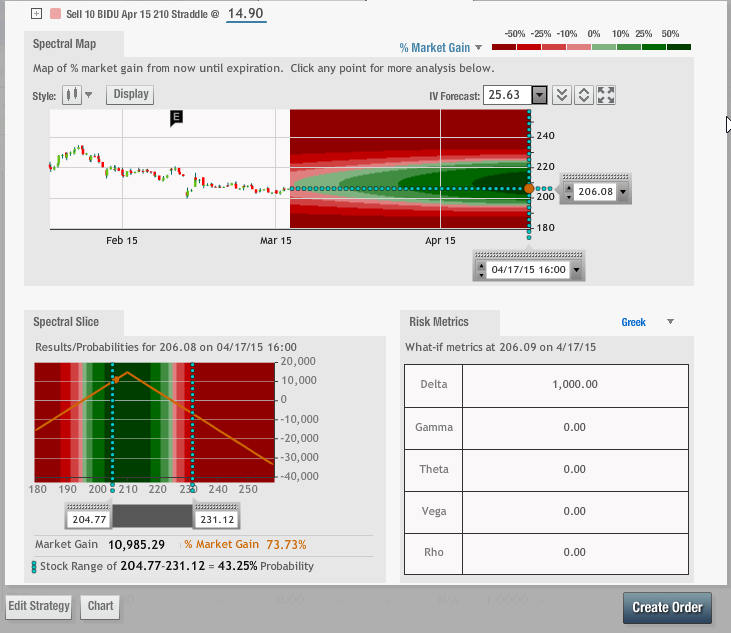
Risk Graphs
The risk graph shows the same risk for a short call and a short put
Short call – Obligated to sell the stock at a certain price for a certain period of time.
Short Put – Obligated to buy the stock a certain price for a certain period of time.
Which has more risk EVEN though the risk graph says they have the same risk?= Short Calls
Why? Unlimited risk because the stock “price” can go up infinity
What’s happening this week and why?
PCE prices .1 vs est .2
Personal Income .3 vs est .5
Personal Spending -.2 vs est -.1
Construction Spending -1.1 vs est .2
ISM Index 52.9 vs est 53
Where will our market end this week?
I think ADP Employment is going to be ok which leads to a meet or beat on Non-Farm Payroll. I will plan on a bullish week but I am worried about the market starting to roll over.
DJIA – Bullish
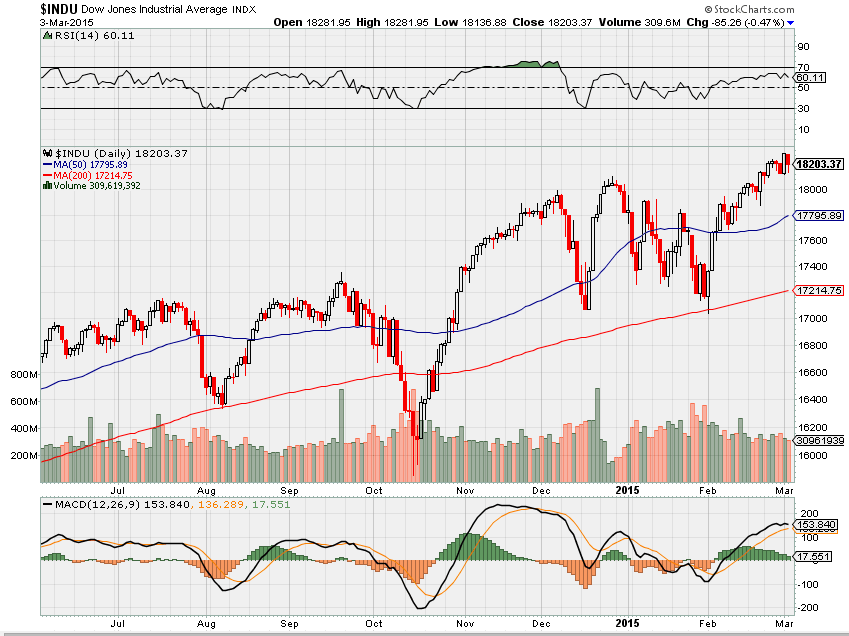
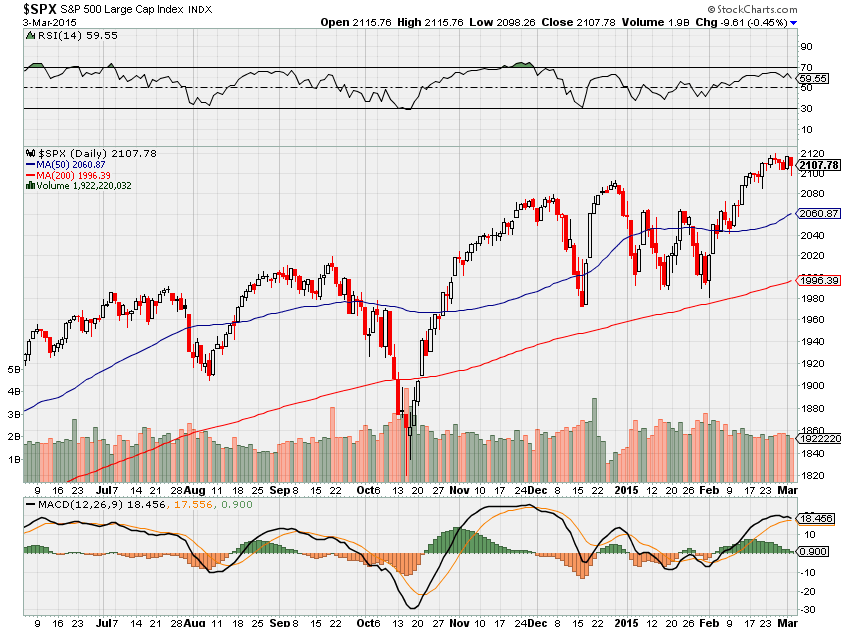
SPX – Bullish
COMP – Bullish
Where Will the SPX end March 2015?
03-03-2015 March will finish flat with a 3.5% move down and back up
02-25-2015 March will finish flat with a 3.5% move down and back up
What is on tap for the rest of the week?=
Earnings:
Tues: AZO, BBY, CTRP, FSTR
Wed: ANF, AEO, JMBA, PETM, VSLR
Thur: KR,
Fri: BIG, FL, SPLS
Econ Reports:
Tues: AUTO, Truck
Wed: MBA, Crude, ADP Employment, ISM Services, Fed Beige Book
Thur: Initial Claims, Challenger Job Cuts, Productivity, Factory Orders
Fri: Ave Workweek, Non-Farm payroll, Private Payroll, Unemployment Rate, Hourly Earnings, Trade Balance, Consumer Credit
Int’l:
Tues – JP: PMI Composite, CN: PMI Composite
Wed – FR:DE:EMU: PMI Composite, GB: CIPS/PMI Services, EMU: Retail Sales
Thurs –
Friday –
Sunday – CN: Merchadise Trade, JP: GDP
How I am looking to trade?
Most of my stocks are thru earnings:
I have some stock only positions – DIS, AAPL, F, MS, SBUX, D, SNDK, P
I have Protective puts on LNCO, ZION, NVDA
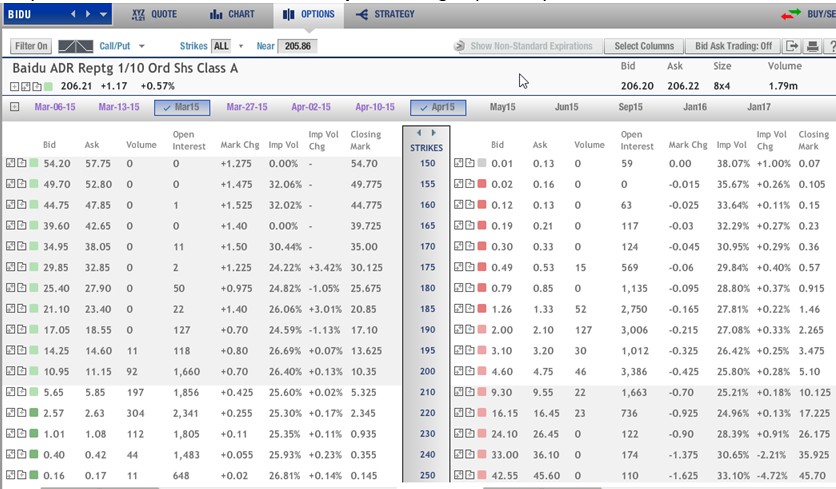
Still IN collars for – BABA, BIDU, FB,
Covered Calls on – VZ, WBA, BAC, C,
Bull Puts – AAPL, DIS, NVDA
Bear Puts – LNCO
Naked Puts – AAPL, V
1st I am creating my earnings list so I don’t miss an earnings for a company I trade
WBA – 03/24
PCLN – 02/19
NKE – 3/19
RHT – 3/26
MU- 4/2
Questions???
www.myhurleyinvestment.com = Blogsite
customerservice@hurleyinvestments.com = Email
Article Links can be followed by being a Twitter follower @kevinmhurley
How Apple Defies The Law Of Large Numbers
Why Ford And GM Will Reward Shareholders In 2015 With Rising Sales And Growing Dividends
Disappointed I Didn’t Buy Disney Before Earnings
Yellen: No rate hike for next couple FOMC meetings
http://www.cnbc.com/id/102447413
Fed rate hike expectations slip to October
http://www.cnbc.com/id/102451132
Janet Yellen: Don’t audit the Fed
http://www.cnbc.com/id/102447544
Visa: Cash Flow Makes It A Winner
http://seekingalpha.com/article/2961206-visa-cash-flow-makes-it-a-winner?source=email_rt_article_readmore&auth_param=vnn53:1af659m:5bdb6bcf871e4e859a35cf8435f935ba&dr=1
Are the 1% really just like the rest of us?
http://www.cnbc.com/id/102463410
These hedge funds are in the doghouse
http://www.cnbc.com/id/102432121
Don’t Give Up 260% Gains Because of This Market Myth | Total Wealth ResearchTotal Wealth Research
http://totalwealthresearch.com/2015/02/dont-give-260-gains-market-myth/
Three key questions to ask your financial advisor
http://www.cnbc.com/id/102463294